Case study
Model predictive in vitro dissolution testing in pharmaceutical Continuous Manufacturing: an equivalence study.
-
Reading time 35 min
-
A study by

-
In collaboration with

Abstract
A predictive mathematical model for tablet dissolution was developed and implemented in an end-to-end integrated continuous manufacturing pilot plant. The tablets were produced for immediate release with a proprietary Extrusion-Molding-Coating (EMC) unit operation. The model development considered the unique dissolution mechanism of the tablets, which was mainly controlled by the swelling and erosion of the excipient matrix. The mechanistic model consisted of the dissolution, diffusion, and population balance of API particles in the swollen matrix, as well as the mass balance of API solute in the buffer solution.
API particle size distribution by laser diffraction and tablet dosage strength by near infrared spectroscopy were imported in real time as model inputs. An equivalence study was demonstrated by comparing the model prediction to the experiments that were conducted according to USP42-NF37 General Chapter <711> Dissolution. Concluding remarks and industrial perspectives on model predictive in vitro dissolution testing are provided.
Introduction
Pharmaceutical tablets are the most common solid oral dosage form. They typically contain several types of excipients in the formulation to achieve the desired fill weight of a dosage, to improve the processability, and to affect the drug release behavior in the body. With different excipient formulations and/or operating conditions, important mechanisms, such as disintegration and dissolution in physiological fluids, may be affected. During drug product development and manufacturing, in vitro dissolution testing plays an important role to characterize drug release profile (Shrivas, et al., 2020).
For example, in vitro dissolution testing is used routinely for batch release testing to detect target product profiles (TPPs) or critical quality attributes (CQAs) changes that affect in vivo release of the drug product. However, unlike batch manufacturing which has a clear definition of batch size and adopts a statistical sampling strategy to detect the quality variations within each batch, an end-to-end Continuous Manufacturing process maintains a state of control to produce drug substance and drug product seamlessly, indicating the potential quality variations in real time and requiring a real-time release testing (RTRT) strategy by nature (Hu, et al., 2020a; Rogers, et al., 2020).
According to ICH Q8(R2) Pharmaceutical Development, RTRT is defined as “the ability to evaluate and ensure the quality of in-process and/or final product based on process data, which typically include a valid combination of measured material attributes and process controls.” Apart from assuring product quality, the RTRT approach is also aimed at reducing labor and cost-intensive off-line product release testing (Markl, et al., 2020).
In light of these points, it is of practical significance to develop a surrogate to in vitro dissolution testing for Continuous Manufacturing processes based on process measurements of critical process parameters (CPPs) and CQAs obtained from process analytical technology (PAT) tools. With this approach, in vitro drug dissolution performance can be evaluated to support an RTRT strategy.
The real-time release testing for identity, assay, and content uniformity using spectroscopy PAT tools has been broadly investigated. Conversely, tablet dissolution requires a more complicated strategy. Normally, a dissolution test requires ~30 minutes for immediate release tablets, and up to multiple hours for extended-release tablets (Nanjwade, Mhase, & Manvi, 2011). A real-time surrogate dissolution test is only possible by developing a mathematical model that can predict dissolution properties (e.g., drug release profiles) using the quality attributes of formulated ingredients and the manufacturing process parameters.
Several research efforts have been reported to predict dissolution characteristics using near infrared spectroscopy (n-IR) with multivariate models (Hernandez, et al., 2016; Otsuka, Tanabe, Osaki, Otsuka, & Ozaki, 2007; Pawar, et al., 2016), or a combination of n-IR and Raman spectroscopic measurements using artificial neural networks (Nagy, et al., 2019). Notably, AstraZeneca deployed a real-time release strategy for an immediate-release tablet manufactured by wet granulation and tablet compression in a batch processing line, wherein the dissolution properties were predicted by a multivariate regression model, based on a design of experiments (DoE) with variations in two material attributes. This was the first achieved regulatory approval of RTRT in Europe (Herkert & Zahn, 2008).
However, these early empirical dissolution models provided an incomplete process and product understanding (e.g., lacking the elucidation of the underlying mass transport mechanisms, limited generalizability when the formulation or process changes). Therefore, first-principles model-based predictive dissolution testing has been emerging rapidly over the past decade (Zaborenko, et al., 2019).
By overcoming the drawbacks of empirical models, first-principles models can be generalized to certain types of tablet formulations (e.g., immediate release, extended release), or to specific manufacturing techniques, such as the Extrusion-Molding-Coating (EMC) process described in this study. With this technique, the rate-limiting step or mechanism of dissolution can be understood and characterized.
It further facilitates the development of model-based predictive in vitro dissolution testing based on chemical engineering first principles.
This can support release testing by dissolution using a rational risk- and science-based manufacturing technology, quantitatively describing the relationship between formulation and dissolution performance (Su, et al., 2019a; Lee, et al., 2020). More importantly, the development of RTRT based on PAT tools, product knowledge, and process understanding provides an excellent opportunity to reduce the burden of off-line end-product testing, some of which is destructive, such as in vitro dissolution testing. A high frequency of sampling and prediction by RTRT also improves manufacturing efficiency by optimizing process operations based on real-time quality insights, such as fine-tuning process parameters based on the models underlying RTRT, and diversion of non-conforming material to waste (Sacher, et al., 2020; Huang, et al., 2020).
It is challenging to develop mathematical models that accurately describe the physics of the drug release process and reliably predict tablet disintegration, dissolution, and ultimately the drug release profile. For example, API powder is often embedded in a polymeric matrix of excipients, which swell and dissolve at a different rate than the API. Polymer swelling, erosion, and dissolution need to be considered to fully understand drug release kinetics. The performance of the excipients largely depends on their physical and chemical properties (e.g., particle size distribution, molecular weight distribution, solubility in water, hydrophilicity, permeability). However, it is not common for excipients to be as tightly controlled compared to the API. Since all models supporting real-time release are categorized as high impact models by the regulatory agencies, they may require rigorous verification and validation (ICH, 2011; Huang, et al., 2020).
In this study, a predictive mathematical model for tablet dissolution was developed and implemented in an end-to-end Integrated Continuous Manufacturing (ICM) pilot plant at CONTINUUS. The tablets were produced for immediate release with a proprietary EMC unit operation by which the API (a water-soluble hydrochloride salt) particles were dispersed in melted polymeric excipients.
The model development considered the unique dissolution mechanism of the EMC tablets, which was mainly controlled by the swelling and erosion of the polymeric matrix due to liquid penetration. Major governing equations of the mechanistic model consisted of the dissolution, diffusion, and population balance of API particles in the swollen polymeric matrix, as well as the mass balance of API solute in the buffer solution.
During in-line implementation, laser diffraction for API particle size distribution and n-IR spectroscopy for tablet dosage strength were imported as model inputs. An equivalence between the predictive in vitro dissolution and off-line testing was demonstrated by comparing the model prediction to the experimental dissolution profiles that were conducted according to USP42-NF37 General Chapter <711> Dissolution. A consistent equivalence was demonstrated during pilot-scale engineering runs of the EMC unit at CONTINUUS.
The manuscript is organized as follows. The ICM pilot plant for end-to-end Continuous Manufacturing is briefly introduced in Section 2. The development of the model-based predictive in vitro dissolution testing is described in Section 3, covering the dissolution test method, dissolution mechanism, and model verification and validation. This is followed by Section 4, Results and Discussion, which demonstrate the equivalence of the proposed model in pilot-scale engineering runs. Conclusions and perspectives are provided in the final section.
End-to-End Integrated Continuous Manufacturing process
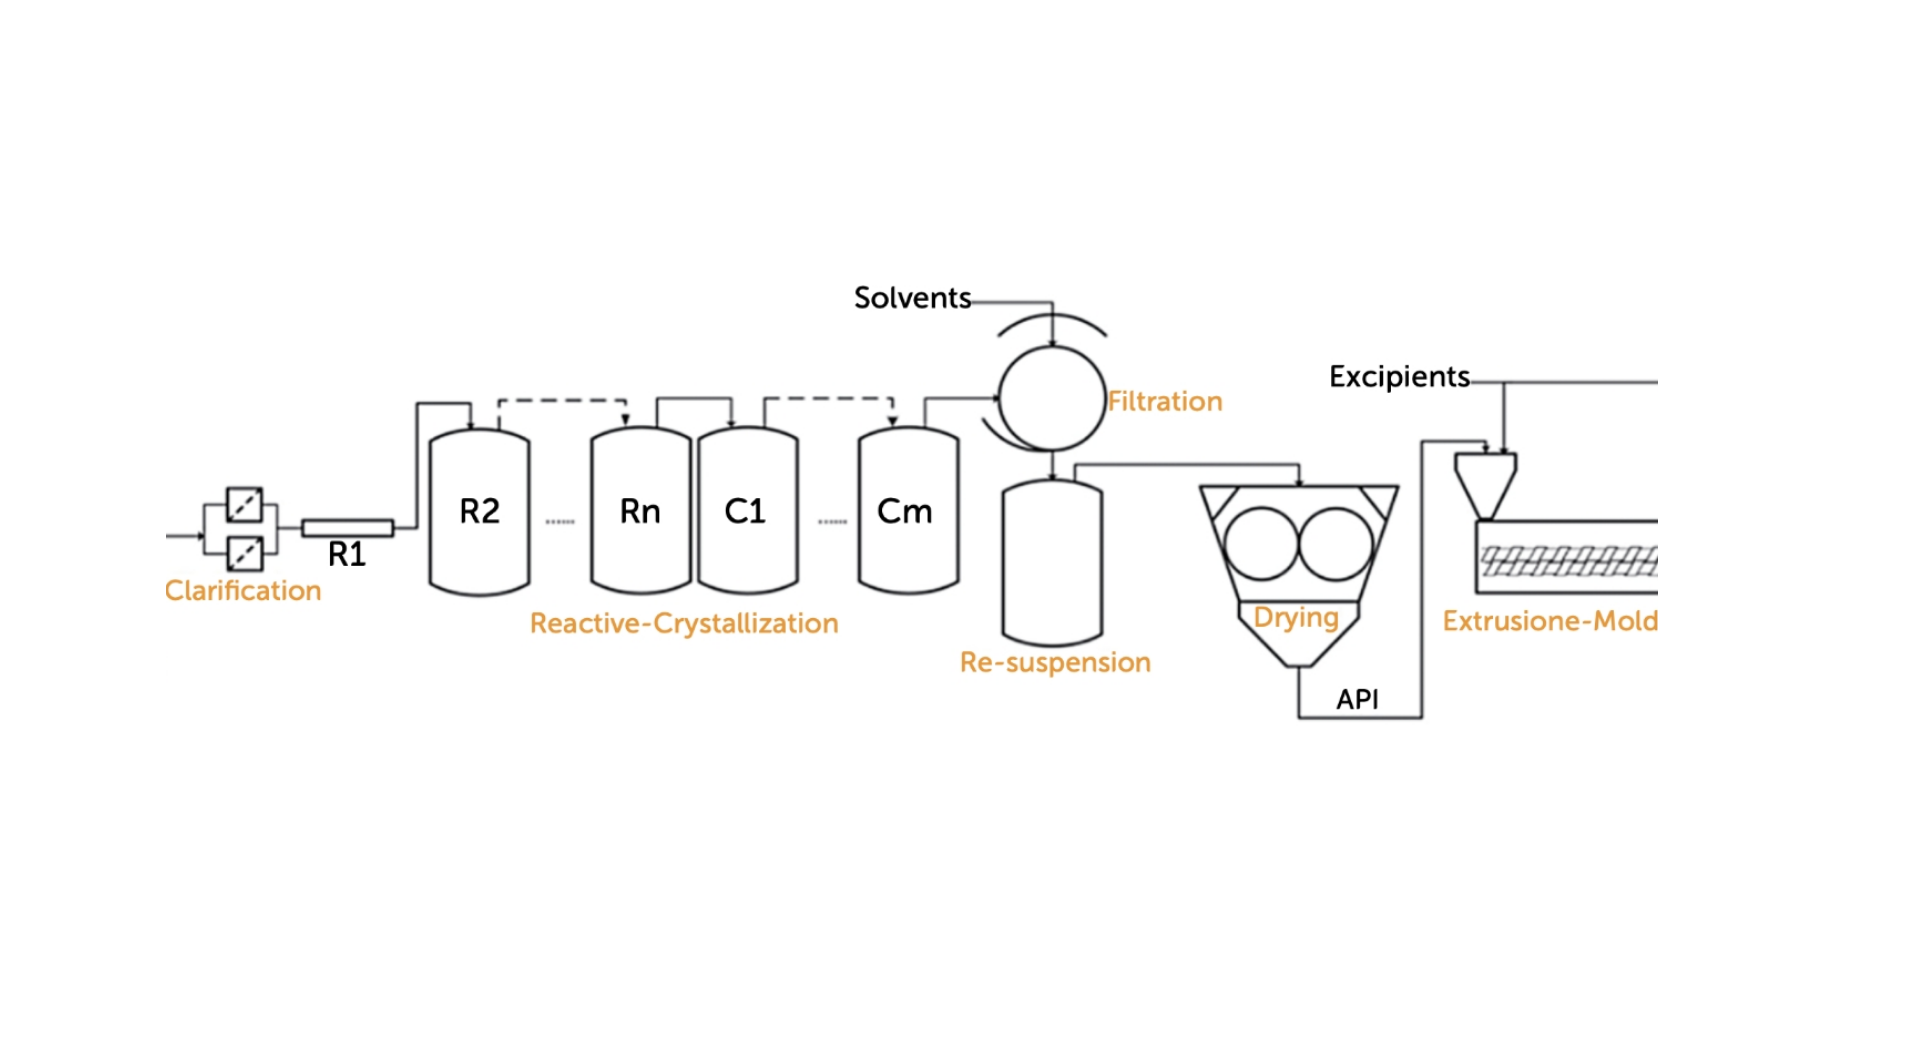
The end-to-end ICM process involves the synthesis, separation, and purification of the API drug substance in the upstream units, as shown in Figure 1. This includes the dissolution of reactants, clarification, and filtration of the feed solution, reactive crystallization to produce the API, rotary filtration of the slurry, re-suspension of the wet cake, high-shear mixing to achieve an in-spec particle size distribution of the API, and drum drying to remove residual solvents. The continuously produced dry API particles are immediately (i.e., seamlessly) vacuum conveyed to the EMC unit to produce the final drug product in the form of tablets.
In the EMC unit, as shown in Figure 2, the API particles are continuously conveyed to a gravimetric feeder, which is placed above a twin-screw extruder, adjacent to another gravimetric feeder for excipients. The excipient feeder is routinely refilled with a pre-blended mixture of excipients. The two feeders continuously deliver the API and excipients to the twin-screw extruder in a set ratio to maintain consistent drug loading. The extruder mixes the API and excipient particles under targeted conditions for temperature, pressure, and shear.
In this process the polymeric excipients are melted to form a homogeneous extrudate, within which solid API particles are dispersed. The extrudate flows through a transfer manifold to enter a core injection barrel. Herein, a backward motion of the injection screw within the barrel allows the extrudate to fill the barrel, while a forward motion of this injection screw injects the extrudate into a mold template. This template is designed with cavities determined by the tablet’s shape and size requirements. After the injection, the mold template is cooled down to allow hardening of the molten extrudate into the desired tablet shape and size.
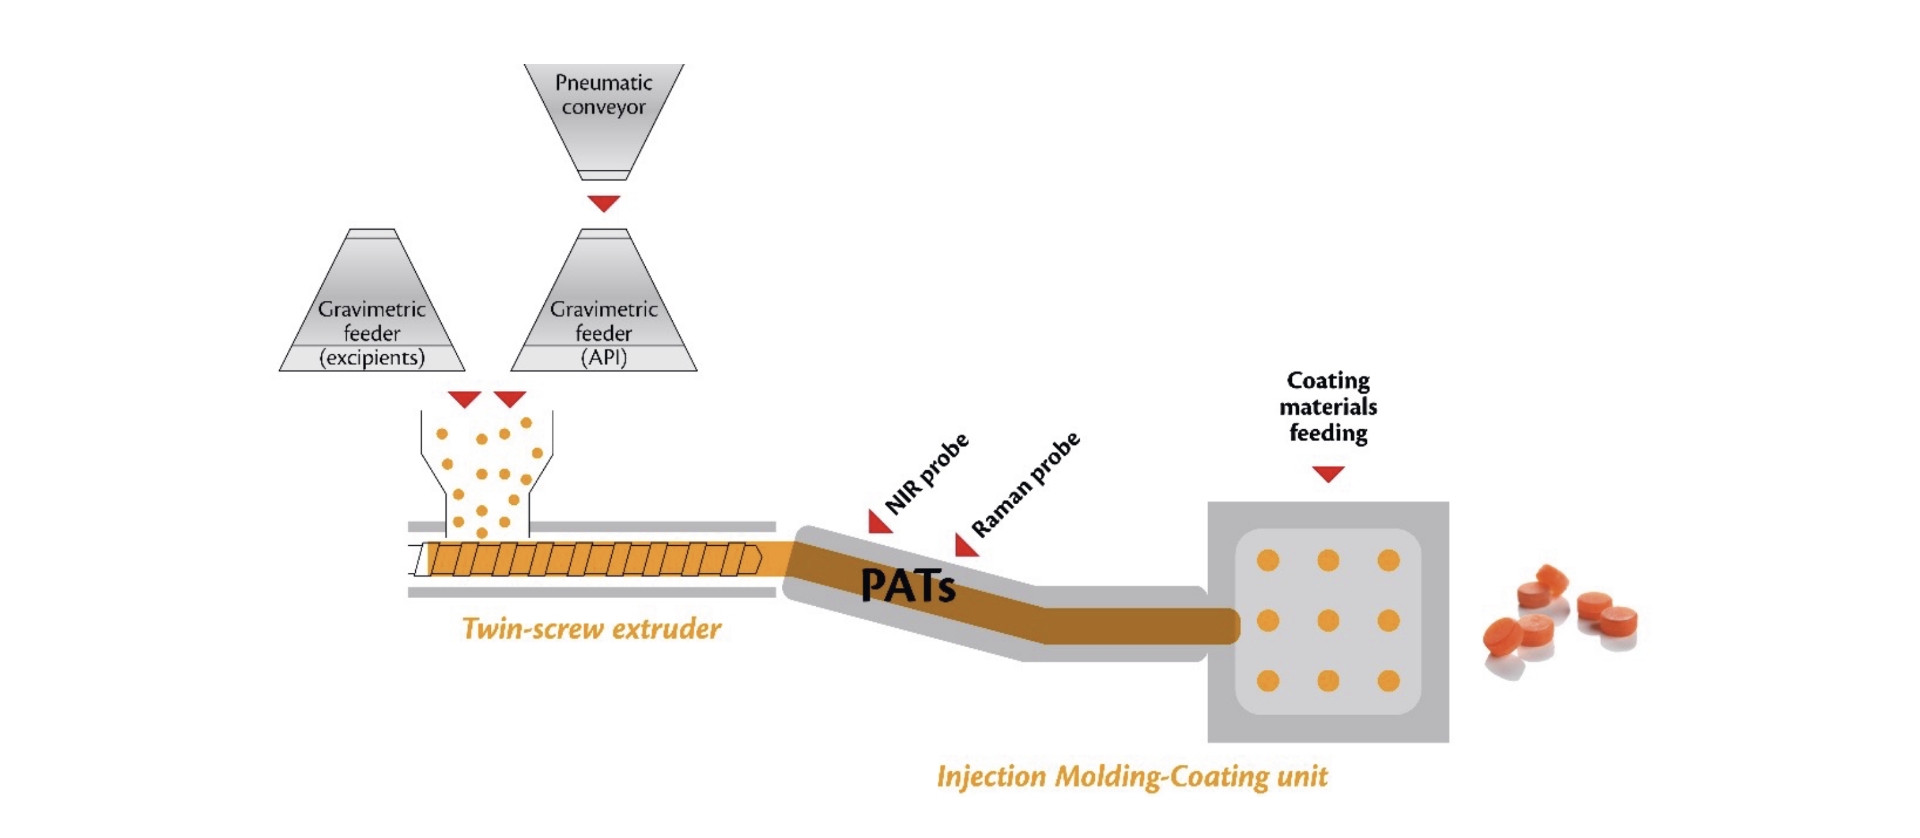
The tablets are then ejected and collected. In this study, the coating was not applied to the model drug. Depending on the dose level and tablet size, the EMC unit may have a production capacity of up to 1.5 kg/h, achieving end-to-end integrated Continuous Manufacturing from starting materials to final product.
More information of the ICM process can be found on the CONTINUUS website (https://www.continuuspharma.com/) and in recent publications (Hu, et al., 2020b; Testa, et al., 2020).
Within the ICM process, PAT tools are used to monitor the CMAs and CQAs in real time. For example, the transfer manifold in the EMC unit is equipped with two optical-grade windows where n-IR and Raman PAT probes are installed. The n-IR probe monitors the degree of uniformity among dosage units by measuring the amount of the drug substance in the extrudate. The Raman probe confirms the solid state of the API in the extrudate. Process variables representing the CPPs are also monitored and controlled, such as the melt pressure and the melt temperature at the exit of the extruder. They are measured with pressure and temperature probes, respectively.
Development of model-based predictive in vitro dissolution testing
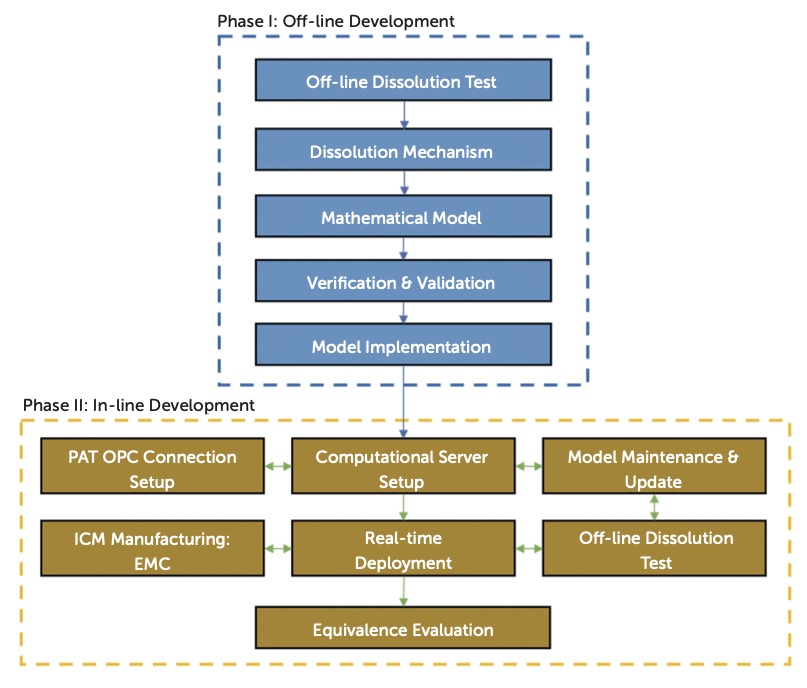
The development of model-based predictive in vitro dissolution testing in this work was designed into two phases, as shown in Figure3. The aim of Phase I was to develop a first-principles mathematical model to predict the in vitro dissolution performance of EMC-produced tablets.
The underlying model considered the unique dissolution mechanism of the EMC tablets with the studied API. The model was also verified and validated to determine the drug dissolution profile. This was followed by Phase II, which set up a computational platform for real-time deployment of the predictive dissolution model. Process measurements and parameters were used as model inputs. The model output of tablet dissolution performance was monitored and used to facilitate decision-making for real-time release. The following subsections provide more details on the key development steps in each phase.
Off-line in vitro dissolution testing
EMC tablets of the API were formulated as an immediate release oral solid dosage form using hydrophilic excipients. The tablet dissolution testing for drug release profile was experimentally characterized according to USP 42-NF 37 General Chapter <711> Dissolution.
According to the USP monograph, the dissolution experiments were performed in an USP apparatus 1 (100 rpm basket rate) with phosphate buffer pH 6.8 as a dissolution medium (1000 mL kept at 37±0.5°C) representing a sink condition.
The on-spec criterion for dissolution testing was defined as: no less than (NLT) 70% of the labeled amount of API must be dissolved within 45 minutes. Hence, these compendial dissolution standards are in general single-point dissolution tests (FDA, 1997).
Although not specified in the USP monograph for dissolution testing of this model drug, it is often necessary to collect dissolution data at multiple time points to adequately characterize the in vitro dissolution performance. To better understand the dissolution kinetics, more frequent sampling is recommended when developing a predictive model for in vitro dissolution.
A drug dissolution profile, instead of a single-point dissolution test, also provides a more rigorous way to validate the predictive dissolution model. Thus, we generated drug dissolution profiles over appropriate time points (i.e., 2.5, 5.0, 7.5, 10, 15, 30, and 45 minutes) during the dissolution test for EMC tablets weighing from 1,160 mg to 1,230 mg, and with a corresponding drug load ranging from 60% to 80%. At every previously mentioned time point, 2 ml of samples were withdrawn from each vessel and replaced with the same volume of dissolution medium at 37°C. The samples were first passed through a filter (0.22 µm), suitably diluted with the dissolution medium, and subsequently measured by a UV-VIS spectrophotometer (see the USP 42-NF 37 General Chapter Ultraviolet-Visible Spectroscopy <857>).
Tablet Dissolution Mechanism
Dissolution of an immediate release tablet generally involves film coat dissolution, tablet disintegration/dissolution, the de-aggregation of granules, and API particle dissolution. Tablets produced from the compaction of an API with excipients normally feature a complex porous microstructure.
This microstructure affects the rate at which the tablet absorbs physiological fluids based on capillary action during dissolution, which is often the rate-limiting step during tablet disintegration and dissolution (Markl & Zeitler, 2017; Quodbach & Kleinebudde, 2015).
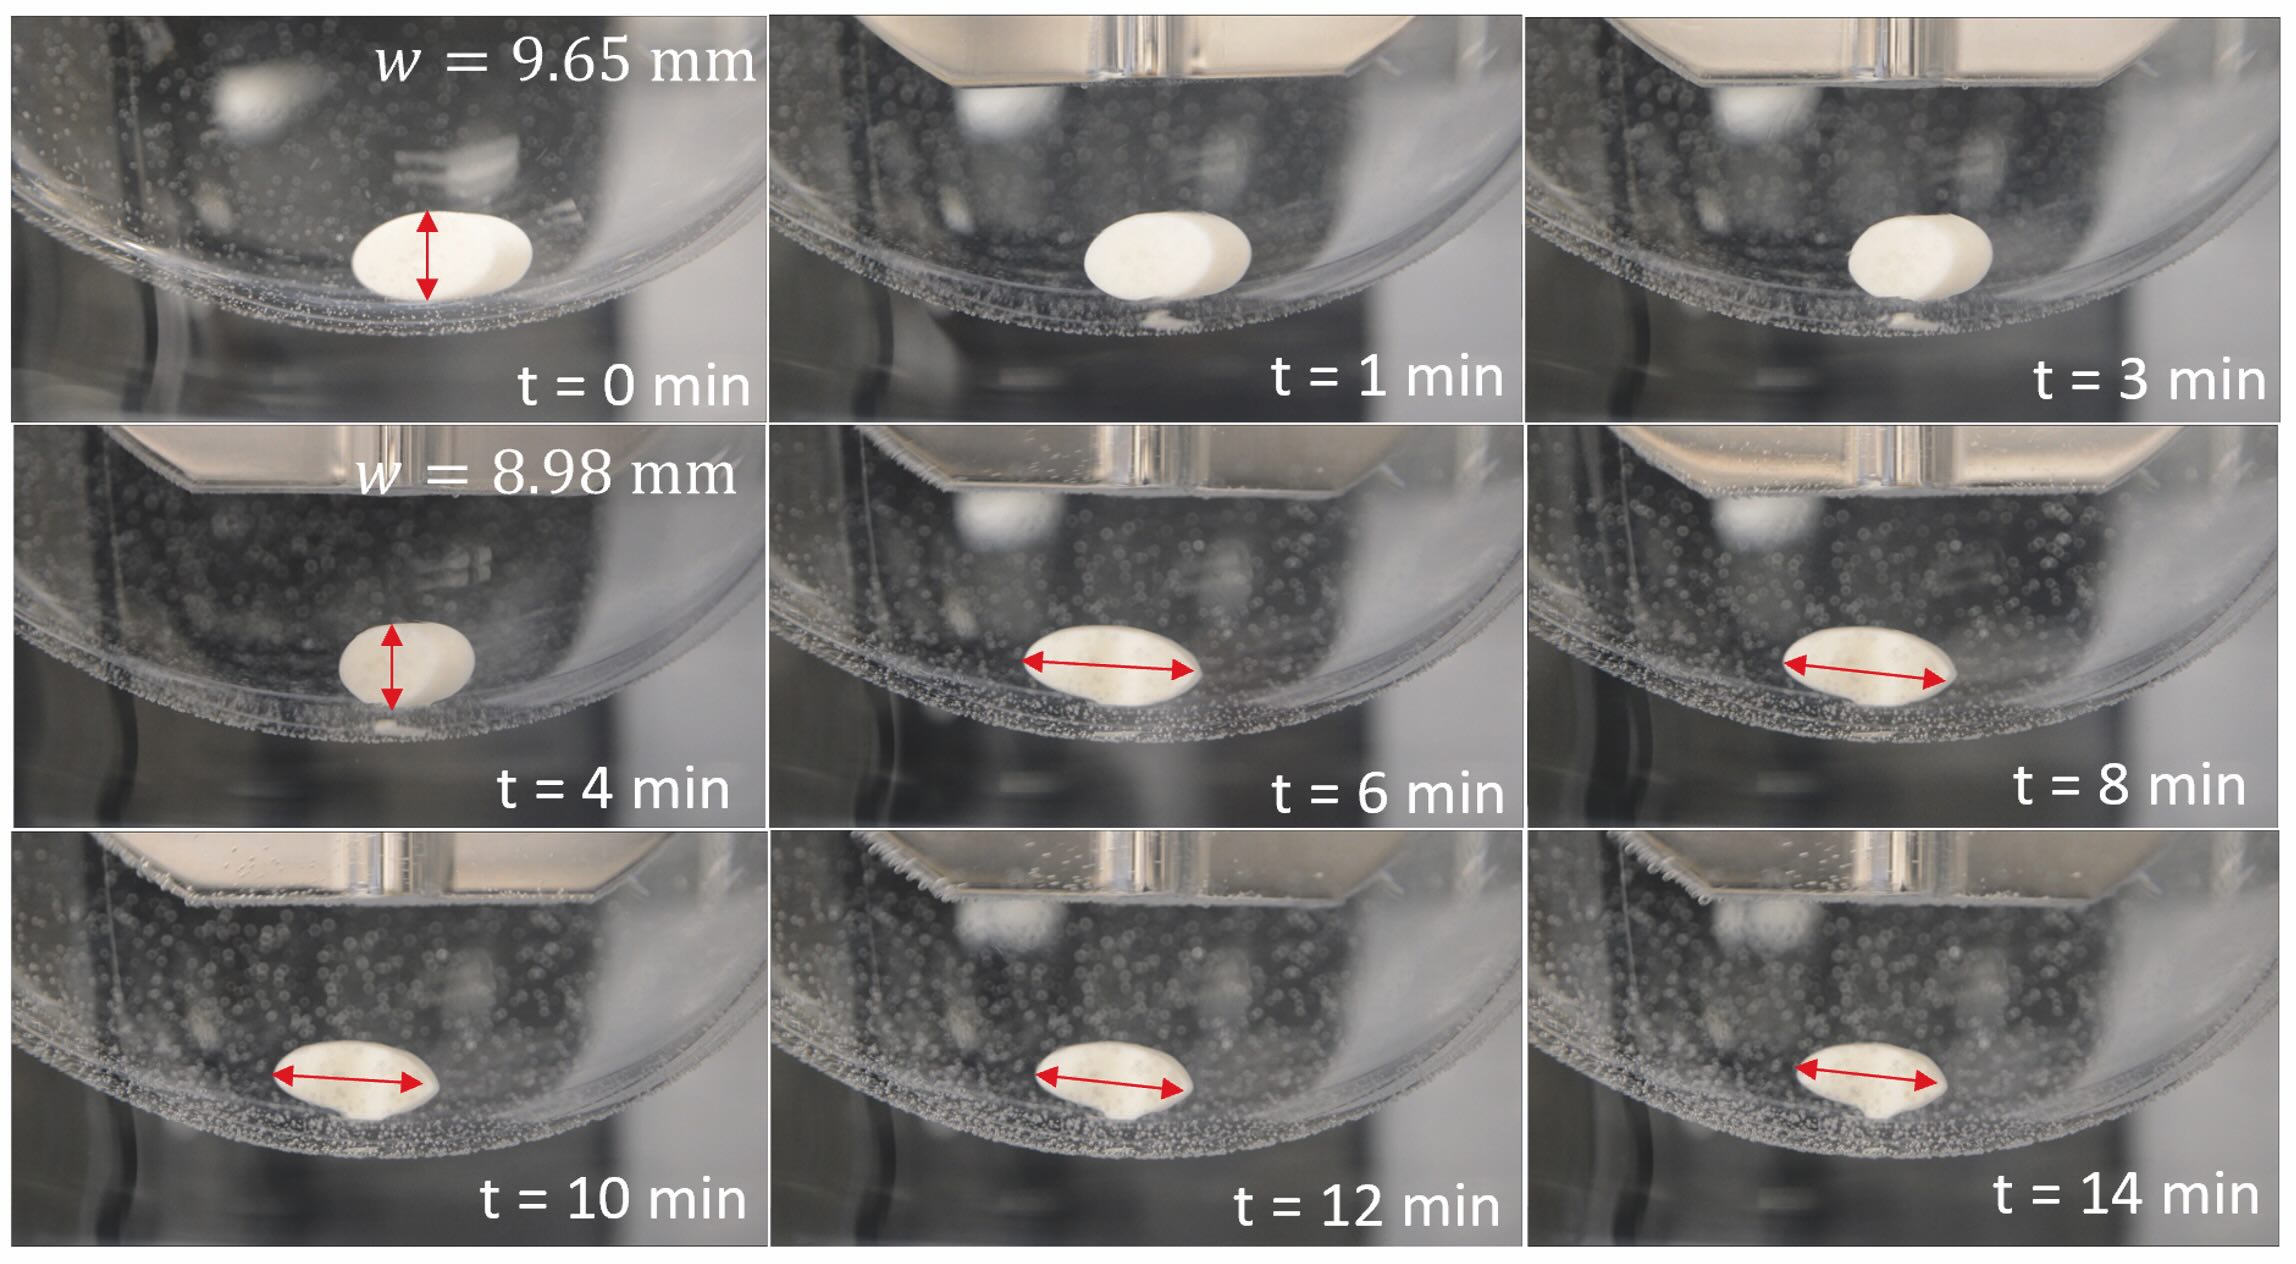
However, the off-line preliminary dissolution tests performed in this study showed that the EMC tablet exhibited neither a visible disintegration step nor a de-aggregation of particle clusters. The tablet gradually shrank in size due to matrix erosion alongside the immediate dissolution of API particles, as shown in Figure 4.
The tablet was placed at the bottom of USP Apparatus 2, with the paddle stirring speed set at 50 rpm (the use of the paddles instead of the baskets was for photograph/video-taking purpose).
This observation is attributed to the reduced porosity in the EMC tablets via hot-melt extrusion and mold injection under high pressure, which reduces the effect of liquid penetration. Furthermore, the API particles (98 wt% < 250 µm) are intact and uniformly dispersed in the fused matrix of polymeric excipients. The maximum processing temperature of the hot-melt extruder was limited to 150 °C, allowing the transition/melting of the polymeric excipients. The API has a higher melting point and thus undergoes no melting or physicochemical changes (i.e., agglomeration, polymorphic change, or decomposition), which is also aided by the short residence times (approximately two minutes). In view of this, the tablet can be defined as a solid dispersion wherein the API is uniformly suspended as crystals in the polymeric carrier, as shown in Figure 5.
In Figure 5, step 1 represents the swelling process of the polymeric matrix.
The swellable polymer undergoes the glassy-rubbery transition after interaction with the dissolution medium, resulting in polymer-chain relaxation, volume increase, and gel layer formation. On a molecular basis, this phenomenon can activate the diffusion of the drug through this layer (Brazel & Peppas, 1999; Colombo, Bettini, Santi, & Peppas, 2000).
The gel layer behaves as a hydrophilic barrier that controls the penetration of water (from the dissolution medium towards the glassy matrix) and the diffusion of the drug (from the rubbery matrix towards the dissolution medium) in step 2.
As time passes and the liquid penetrates, the gel layer becomes hydrated and starts eroding and dissolving. The swelling kinetics depend on polymer composition, molecular weight, crosslinking, and drug loading. The dissolution of API particles within the swollen polymeric matrix also reduces the potential exertion of swelling stresses on the overall tablet. As such, no tablet disintegration step is expected, and the overall tablet dissolution is rate-limited to the eroding of edges in step 3.
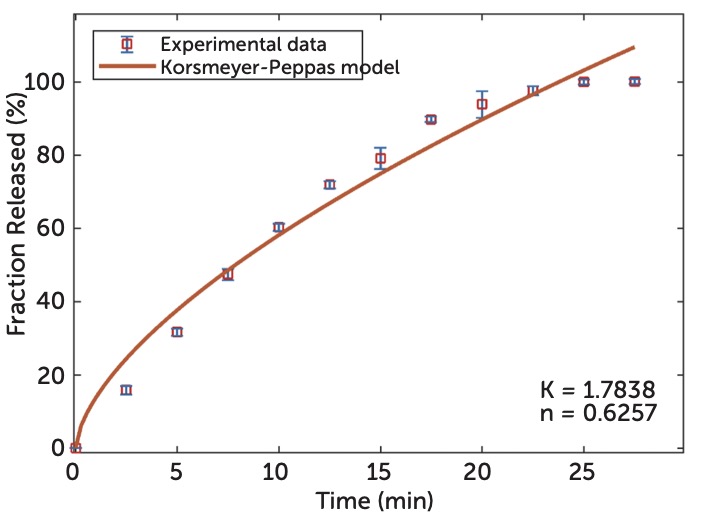
The classical relationship of the Korsmeyer-Peppas model was employed to determine the mechanism of drug release as described below.

where Mt/M∞ is the fraction of drug released at time t, K is the rate constant, and n is the release exponent. The value of n is used to characterize different release mechanisms for cylindrical shaped tablets.
The value of n is used to characterize different release mechanisms for cylindrical shaped tablets.
By fitting the model with the tablet dissolution profiles, as shown in Figure 6, the resulting value of 0.6257 indicates a coupling of diffusion and erosion mechanisms (Korsmeyer, Gurny, Doelker, Buri, & Peppas, 1983), the so-called anomalous (non-Fickian) diffusion (0.5<n <1.0).
This indicates that the drug release from the EMC tablets was controlled more by polymer swelling, followed by drug dissolution and diffusion through the swollen polymer, resulting in the apparent erosion of the whole tablet. Therefore, a first-principles mathematical model considering the API dissolution/diffusion and tablet matrix erosion would be relevant to predict the drug release profile.
The first-principles mathematical model
The EMC tablets have a uniform appearance, which was determined by the mold cavity volume, shape, and size, as depicted in Figure 7.
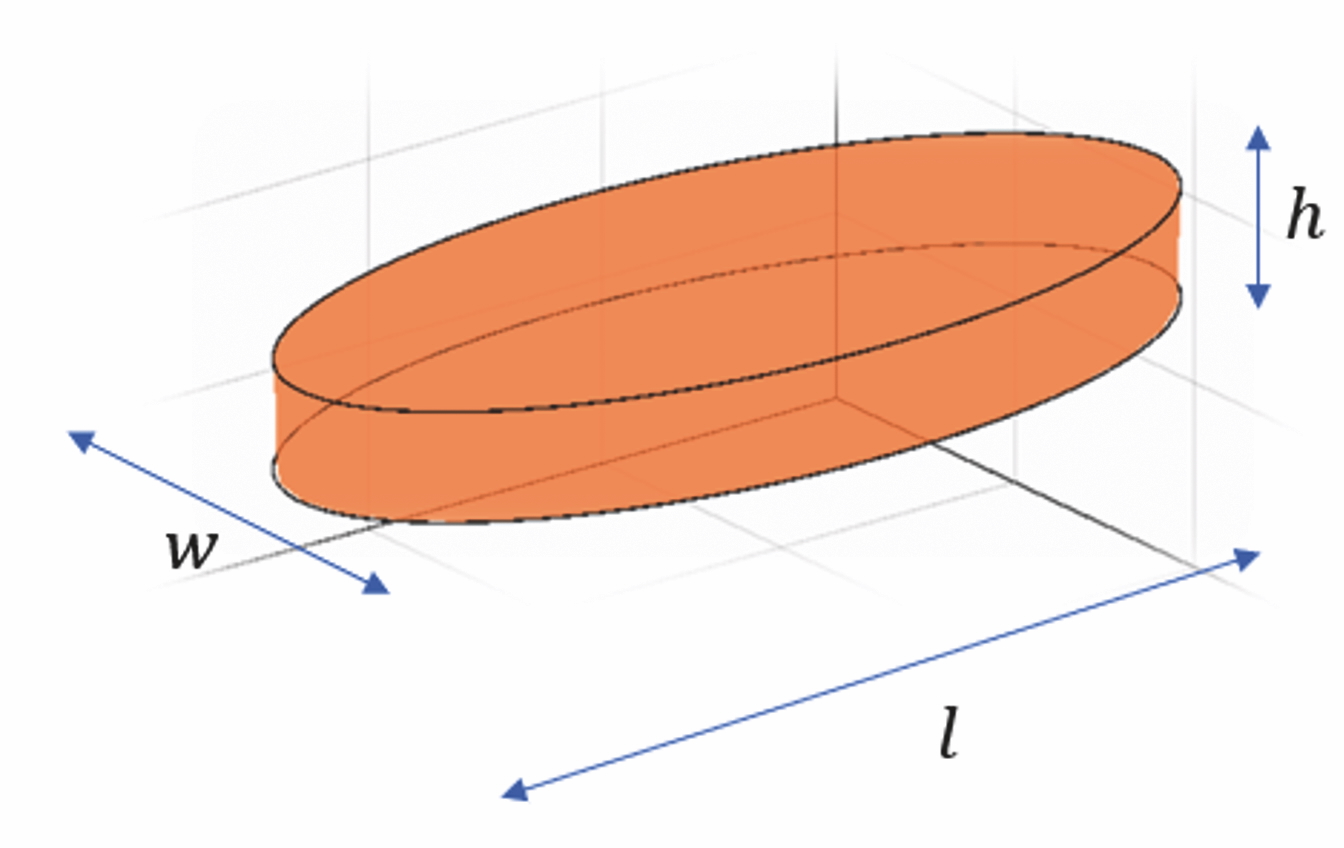
The EMC unit uses a mold template for extrudate injection. An elliptical (w < l) or cylindrical (w = l) cavity is used, depending on the volume of the dosages.
For an elliptical or cylindrical tablet with length l, width w, and height of h, the tablet volume Vt as a function of time t can be described as follows,
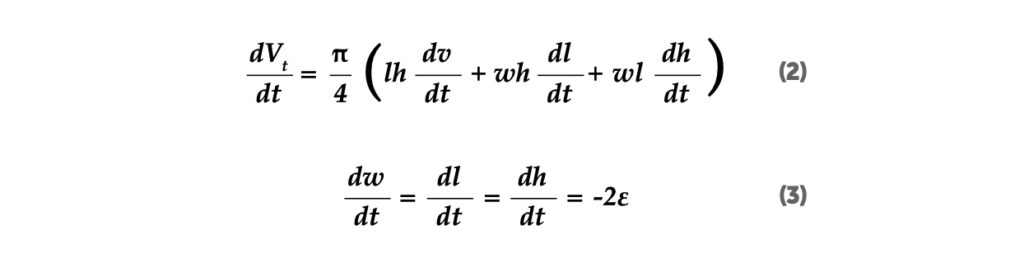
where ε is the assumed constant erosion rate of the tablet surface in response to the rate-limited swelling and dissolution of polymeric matrix (Gavi & Reynolds, 2014). This assumption relies on the homogeneity of the extrudate, which can be confirmed by real-time, in-line n-IR measurement of the API mass fraction. Likewise, when one considers the tablet lying inside a spinning mesh basket that is suspended in the dissolution medium, the erosion rate is omni-directional on the tablet surface, as indicated by Equation (3).
The mechanism wherein the API particles are exposed to the dissolution medium (their dissolution and subsequent diffusion into the bulk solution) can be described by a population balance model. We define the number-based particle size distribution of exposed API particles in the swollen polymeric matrix as n, and the corresponding particle size distribution of API within the glassy polymeric matrix is n0. Then, the population balance model for exposed solid API particles and mass balance for dissolved API solute in the bulk buffer medium can be characterized as follows,

where D is the API particle dissolution rate in size reduction, L is the particle characteristic size, kv is the corresponding volume shape factor, ρ is the particle density, Ddiff is the diffusion coefficient, ldiff is the thickness of diffusion layer, C is the concentration of dissolved API solute, and C* is its solubility. The second term on the right-hand side of Equation (4) represents the new API particles exposed due to tablet erosion; the reduction in tablet volume gradually introduces new particles into the swollen polymeric layer. The first term on the right-hand side of Equation (5) uses an integral term for the second moment of the particle size distribution n to characterize the total surface area of API particles exposed to the dissolution medium in the swollen polymeric layer. Equation (6) of the particle dissolution rate assumes that particle dissolution is diffusion limited and is derived from the classical Nernst-Brunner diffusion equation (Wilson, Wren, & Reynolds, 2012). Overall, the major governing equations of the model consist of the dissolution, diffusion, and population balance of API particles within the swollen polymeric layer, as well as the mass balance of API solute in the buffer solution. The resulting mathematical model includes a partial differential equation with an integral for the population balance of the API particles.
Model verification and validation
A model should be rigorously verified and validated to the degree needed for its intended purpose (ICH-Q13, 2022). Model verification ensures that the model is correctly implemented, matching specifications and assumptions of the model concept.
One of the critical specifications of the tablet dissolution model is the mass balance of API, viz.; the total amount of solid API within the tablet should match the total amount of API solute in the buffer medium after complete dissolution. This requirement of mass balance relies on the accuracy and robustness of solving the population balance equation of API particles and the mass balance equation of API solute in the proposed model, viz., Equations (4) and (5), respectively.
To solve this system of integral and partial differential equations, we referenced a tablet dissolution model reported in the literature that consists of a simple discretized method of classes (Hounslow, Ryall, & Marshall, 1988; Wilson, Wren, & Reynolds, 2012). However, this simple discretization method with first-order accuracy encountered a numerical diffusion problem when solving Equation (4). One of the potential reasons for this unsatisfactory performance is that the new particles n0 entering the dissolution medium were not uniform in size, as assumed in the previous literature.
In light of this challenge, a high-resolution finite volume method (FVM) of upwind approximation with a second-order accuracy (Koren, 1993; Su, Chiu, & Braatz, 2014) was adopted to solve the population balance model. Model performance was satisfactory with regard to the API mass balance (see Figure 10 – 100% of releases were predicted steadily after tablet dissolution). The discretization scheme of the finite volume method is illustrated in Figure 8. The concept of “cell” is adopted in the FVM method, by which ni is the number-based particle size density distribution in the ith cell of Li, with boundaries of Li-1/2, and Li+1/2. The cell boundary is the medium point between the adjacent cells. It is worth mentioning that the discretization of Li is adaptive to either arithmetic or geometric progression, such as the geometric progression commonly used in laser diffraction particle size distribution measurement. Consequently, the proposed FVM algorithm could discretize the population balance model of Equation (4) into a set of ODEs, as shown in Equation (7).
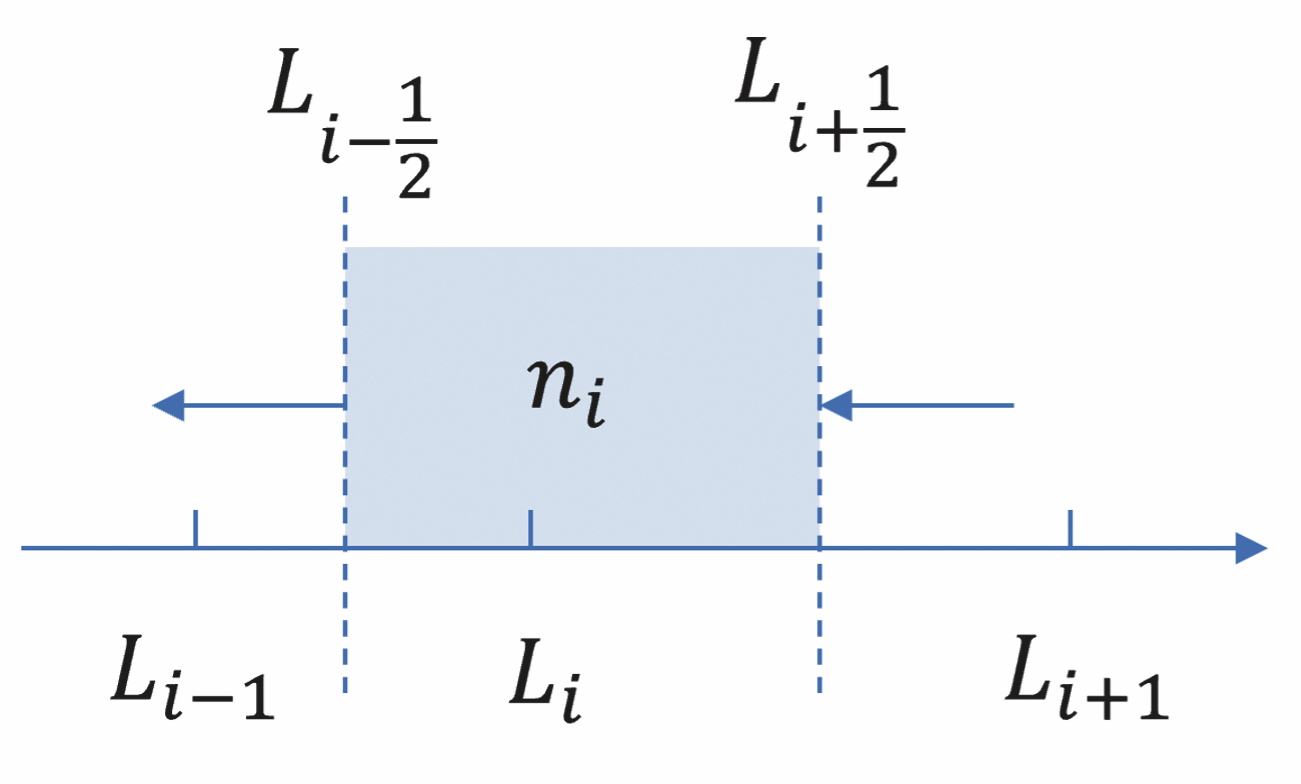
Appropriate notions were also applied, e.g., ni+1/2 is the number density n at the boundary, and Di+1/2 is the dissolution rate D at the boundary. The calculation of the boundary values of n also involves a flux-limiting function to avoid spurious oscillations due to sharp changes in the numerical solution domain, e.g., the immediate dissolution. Further details of the calculation are provided in the original works.

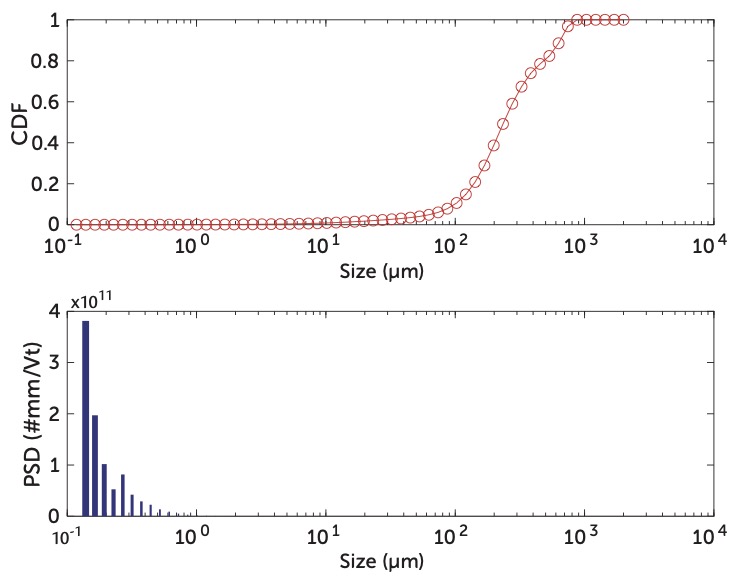
Model input of the API particle size distribution n0 in the tablet for the finite volume method can be calculated directly with in-line PAT measurements from the Malvern Insitec laser diffraction system (located post-continuous drying) for particle size distribution (Wilms, Meier, & Kleinebudde, 2021), together with the n-IR (located downstream in the EMC manifold) for API mass fraction analysis in the extrudate, as shown in Figure 9.
The other model input parameters were obtained accordingly from manufacturing or experimental settings, e.g., the tablet erosion rate was estimated from the preliminary dissolution tests, as shown in Figure 4. The receding width of the tablet for the first four minutes results in an average erosion rate ε of 10.1 mm/hour for an EMC tablet with a 70% drug load.. Model validation must be performed through a series of tests consistent with its intended application. This model-based predictive in vitro dissolution testing is expected to be used as a surrogate to the off-line dissolution test. For this reason, a performance index of similarity factor f2, which is commonly used in bioequivalence tests, was employed in this work to assess the predictive performance of the first-principles mathematical model (Stevens, Gray, Dorantes, Gold, & Pham, 2015).
The similarity factor, f2, measures the sameness of dissolution profiles, usually between a reference and a test dissolution profile, to determine the bioequivalence of an oral dosage form. The f2 factor is a logarithmic reciprocal square root transformation of the sum of squared error in the percent dissolution. Its calculation is represented in Equation (8),

where n is the number of time points in the dissolution profile, Rt is the mean dissolution value for a reference product at time t, and Tt is the mean dissolution value for the test product at that same time point. It should be noted that more than three time points (zero excluded) may be required to adequately characterize the shape of the dissolution profile (Diaz, Langer, Bandi, Likar, & Alstine, 2016). Two dissolution profiles are considered similar when the f2 value is > 50, indicating the difference between the two dissolution profiles is less than 10%. However, to allow use of mean data, normally the coefficient of variation should not be more than 20 percent at the earlier time points (e.g., 15 minutes), and should not be more than 10 percent at the other time points. Only one measurement should be considered after 85 percent dissolution of both profiles (FDA U. , 2017).
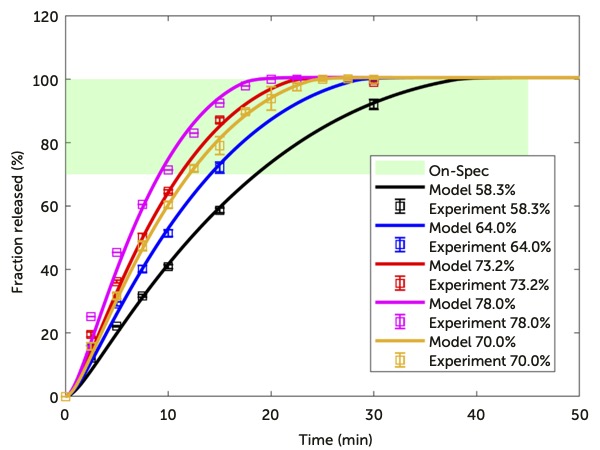
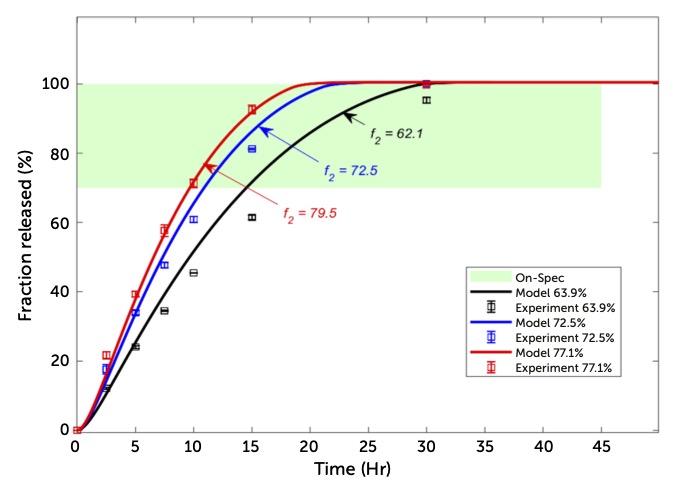
Five tablet dissolution profiles from the data historian were extracted for model validation. The model performance in fitting the five dissolution profiles is shown in Figure 10. We observe that the model predictions agree well with the experimental profiles, with a minimum similarity factor of 64. Herein, a relatively fast dissolution rate of API particles D was considered to account for the rate-limited step of polymer swelling and erosion. In addition, a regressed correlation between the tablet erosion rate ε and API mass fraction was also identified (intent not shown here). Overall, the model validity for predictive in vitro dissolution testing was confirmed.
In-line model implementation
To achieve real-time release, the proposed first-principles mathematical model was implemented at the ICM pilot plant at CONTINUUS. The pilot plant was installed with the Emerson DeltaVTM v13 distributed control system (DCS), which supports an easy-to-use system of integration and automation, e.g., an OPC (Open Platform Communications) server, data historian. OPC is a series of interoperability standards and specifications for industrial telecommunications, with high security and reliability. The mathematical model was routinely solved in real time using MATLAB® (2017a, The MathWorks) software, which was installed at one of the DeltaV® application stations (Su, et al., 2019b; Singh, Sahay, Muzzio, Ierapetritou, & Ramachandran, 2014). Model inputs, such as the API mass fraction measured by n-IR at the EMC transfer manifold and the API particle size distribution measured by Malvern® Insitec laser diffraction post-drum dryer, were real-time communicated to MATLAB using OPC technology (time delay due to materials transfer from upstream to downstream was considered). The model output of 70% dissolution time of total API dose amount (the dissolution time at which 70% of total API contained in the tablet is dissolved) was also relayed back to the DeltaV DCS system for process monitoring and control purposes. The status of the model execution, maintenance, and alarms were also configured.
Results and discussion
Two examples of end-to-end ICM engineering runs for EMC tablet manufacturing are provided in this work to illustrate the model-based predictive in vitro dissolution testing, and to demonstrate the equivalence to routine off-line in vitro dissolution testing according to USP 42-NF 37 General Chapter <711> Dissolution.
In Example I, five step changes in the drug strength, which was accomplished by changing the API mass fraction in the extrudate, was considered (Figure 11). The step changes in API mass fraction were implemented over the course of four hours by changing the ratio of API and excipient feed flowrates; these were monitored by in-line n-IR spectroscopy and off-line HPLC. The disparities in n-IR predictions were due to the incurred flush between step changes in the EMC manifold (intentionally performed to “clean” the system before changing the API wt%), resulting in the incorrect prediction of API wt% outside its calibration range. Therefore, during the flush the model prediction of 70% dissolution time was disrupted. Three samples of tablets were taken at the 1st, 3rd, and 5th step for off-line in vitro dissolution testing. An interpolated dissolution time of 70% release was obtained from the experimental dissolution profile. The model predictions agree very well with the three off-line dissolution test results. It is important to note that a sampling time of one minute was considered for the real-time predictive dissolution testing. This was in response to the process dynamics in the EMC unit (the EMC had a mean residence time of two minutes, the n-IR probe had a sampling time of 20 seconds, and the predictive model computational time was less than 20 seconds).
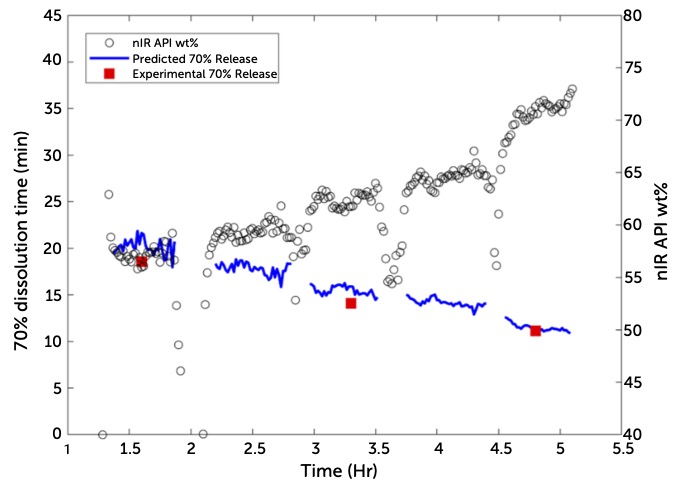
A correlation between API mass fraction and 70% release time was observed. A lower API mass fraction, or higher excipient mass fraction, resulted in slower tablet dissolution. This is consistent with the dissolution mechanism that states that the swelling and eroding of the polymeric matrix is the rate-limiting step.
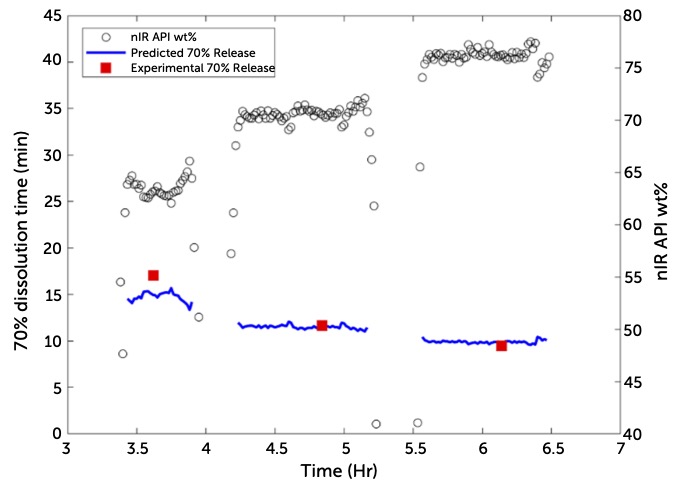
Another EMC manufacturing experiment, Example II, involved three step changes in API mass fraction, as shown in Figure 12. By utilizing the real-time PAT measurement of API powder particle size distribution and the API mass fraction in extrudate, the model-based predictive dissolution testing was capable of predicting consistent and accurate 70% release time of EMC tablets, achieving real-time release testing of the in vitro dissolution profile. A comparison of tablet dissolution profiles between the model prediction and off-line testing is also shown in Figure 13. The similarity factor f2 is 62.1, 72.5, and 79.5 for the three steps, respectively, which further solidifies the model validity and equivalence to off-line dissolution testing. Overall, all the tablets tested, either by predictive or off-line dissolution testing, were within specification for in vitro dissolution performance, viz., NLT 70% of the labeled API dose amount is dissolved by 45 minutes, as highlighted by the green-shaded area in Figure 13.
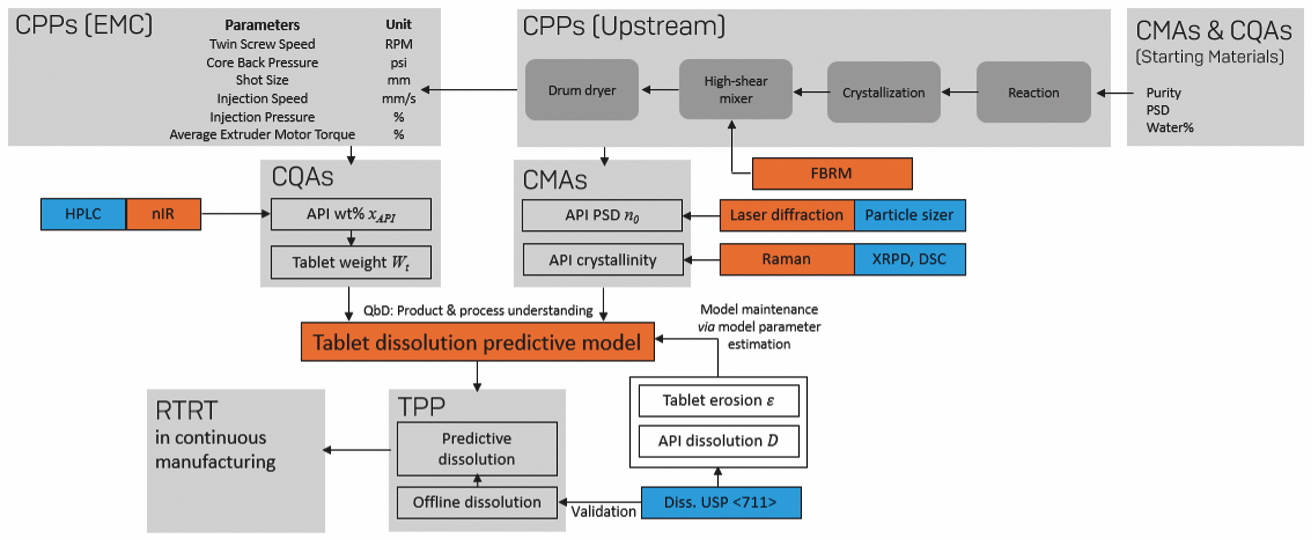
A holistic approach is necessary to demonstrate the equivalence of model-based predictive dissolution testing to off-line dissolution testing. This is because the proposed predictive dissolution testing is built on the existing PAT tools that support in-line and real-time measurements of process parameters and material properties. Their equivalences to the primary analytical methods are an indispensable part of predictive dissolution testing, as illustrated in Figure 14. For example, the API mass fraction measured by a secondary n-IR probe should demonstrate an equivalence to off-line primary HPLC analysis. Since there is no working standard on equivalence that can be used routinely to calibrate or check the predictive dissolution testing, routine dissolution testing, conducted at a low frequency, will be necessary and important as a continuous verification effort to monitor model performance. Model maintenance by parameter re-estimation, e.g., tablet erosion rate ε or API particle dissolution rate D, using off-line dissolution testing results will be necessary when model performance degrades due to variations in process parameters and material properties, which constitutes a major source of risk and variation as understood in this study.
Conversely, the predictive dissolution model for RTRT is considered a high-impact model to determine CQAs or TPPs that are not subsequently tested downstream, and any changes in the model could be subject to regulatory scrutiny. A risk analysis of these variations and their impact on model performance and release decision-making will be important and helpful (Ganesh, et al., 2020; Su, et al., 2019b).
To summarize, the equivalence of model-based predictive dissolution testing should be developed and demonstrated based on risk- and science-based product knowledge and process understanding. Moreover, the product knowledge and process understanding of tablet dissolution could also enable customized release profiles for precision or personalized medicines in future drug development efforts (Nanjwade, Mhase, & Manvi, 2011; Gomeni, et al., 2017).

Conclusions and perspectives
An equivalence study of model-predictive dissolution testing to enable real-time release testing for an end-to-end integrated Continuous Manufacturing process was demonstrated in this work by comparing model predictions to the experimental dissolution profiles that were conducted according to USP 42-NF37 General Chapter <711> Dissolution.
A consistent equivalence was demonstrated during pilot-scale engineering runs of the ICM/EMC unit at CONTINUUS. The proposed strategy of using a first-principles model for predictive dissolution testing is not limited to the specific API described in this work, but is general, and can be applied to other APIs for RTRT implementation using the ICM/EMC platform/technology.
We recommend starting model development as early as possible, incorporating formulation development and dissolution mechanism understanding. This will increase the in-depth product knowledge of dissolution performance and accelerate the development of a first-principles mathematical model.
This will help verify the numerical solution scheme for the mathematical model, and in particular for a first-principles mathematical model.
For the model-based predictive testing, it is also important to validate the assumptions underlying the model equations. For example, in this study empirical models of tablet erosion rate and tablet density to the API mass fraction were only valid when the formulation excipients were fixed, and no significant variations occurred in material properties and process parameters (see Figure 14). However, changes in material properties of the supplied excipients have traditionally not been tightly controlled compared to those of the active ingredients. Hence, it is recommended to monitor the validity of these empirical models and refine their model equations/parameters accordingly. These variations may cause changes in the density, and ultimately the observed weight, of tablets produced in a fixed mold cavity volume. Proactive maintenance and validation of this relationship is encouraged.
Disclaimer
Certain commercial equipment, instruments, and materials are identified in this article to adequately specify the experimental procedure. Such identification does not imply approval, endorsement, or certification by USP of a particular brand or product, nor does it imply that the equipment, instrument, or material is necessarily the best available for the purpose, nor that any other brand or product was judged to be unsatisfactory or inadequate.
References
[1] Brazel, C. S., & Peppas, N. (1999). Mechanisms of solute and drug transport in relaxing, swellable, hydrophilic glassy polymers. Polymer, 40(12), 3383-3398.
[2] Colombo, P., Bettini, R., Santi, P., & Peppas, N. (2000). Swellable matrices for controlled drug delivery: Gel-layer behaviour, mechanisms and optimal performance. Pharmaceutical Science & Technology Today, 3(6), 198-204.
[3] Costa, P., & Lobo, J. M. (2001). Modeling and comparison of dissolution profiles. European Journal of Pharmaceutical Sciences, 13, 123-133.
[4] Diaz, D. A., Langer, C. S., Bandi, N. T., Likar, M. D., & Alstine, L. V. (2016). Dissolution similarity requirements: how similar or dissimilar are the global regulatory expectations? The AAPS Journal, 18(1), 15-22.
[5] FDA. (1997). Guidance for Industry: Dissolution testing of immediate release solid oral dosage forms. United States Food and Drug Administration.
[6] FDA, U. (2017). Guidance for Industry. Wavier of in vivo bioavailability studies for immediate-release solid oral dosage forms based on a biopharmaceutics classification system.
[7] Ganesh, S., Su, Q., Vo, L. B., Pepka, N., Rentz, B., Vann, L., . . . Reklaitis, G. (2020). Design of condition-based maintenance framework for process operations management in pharmaceutical Continuous Manufacturing. International Journal of Pharmaceutics, 587, 119621.
[8] Gavi, E., & Reynolds, G. (2014). System model of a tablet manufacturing process. Computers and Chemical Engineering, 71, 130-140.
[9] Gomeni, R., Bressolle-Gomeni, F., Spencer, T., Faraone, S., Fang, L., & Babiskin, A. (2017). Model-based approach for optimizing study design and clinical drug performances of extended-release formulations of Methylphenidate for the treatment of ADHD. Clin Pharmacol Ther., 102(6), 951-960.
[10] Herkert, T., & Zahn, M. (2008). Paving the way to regulatory flexibility: The first approval of real-time release in Europe. RAJ Pharma, 19, 155-159.
[11] Hernandez, E., Pawar, P., Keyvan, G., Wang, Y., Velez, N., Gallegari, G., . . . Romañach, R. (2016). Prediction of dissolution profiles by non-destructive near infrared spectroscopy in tablets subjected to different levels of strain. Journal of Pharmaceutical and Biomedical Analysis, 117, 568-576.
[12] Hounslow, M., Ryall, R., & Marshall, V. (1988). A discretized population balance for nucleation, growth, and aggregation. AIChE Journal, 34(11), 1821-1832.
[13] Hu, C., Shores, B. T., Derech, R. A., Testa, C. J., Hermant, P., Wu, W., . . . Mascia, S. (2020b). Continuous reactive crystallization of an API in PFR-CSTR cascade with in-line PATs. Reaction Chemistry & Engineering, 5, 1950-1962.
[14] Hu, C., Testa, C. J., Wu, W., Shvedova, K., Shen, D. E., Sayin, R., . . . Mascia, S. (2020a). An automated modular assembly line for drugs in a miniaturized plant. ChemComm, 56, 1026-1029.
[15] Huang, J., O’Connor, T., Ahmed, K., Chatterjee, S., Garvin, C., Ghosh, K., . . . Warman, M. (2020). AIChE PD2M Advanced process control workshop-moving APC forward in the pharmaceutical industry. Journal of Advanced Manufacturing and Processing, In press. doi: https://doi.org/10.1002/amp2.10071
[16] ICH. (2011). ICH Quality Implementation Working Group Points to Consider (R2), ICH-endorsed guide for ICT Q8/Q9/Q10 implementation.
[17] ICH-Q13. (2022). Continuous Manufacturing of Drug Substance and Drug Products Q13. ICH.
[18] Koren, B. (1993). A robust upwind discretization method of advection, diffusion and source terms. . En C. Vreugdenhill, & B. Koren, Numerical Methods for Advection-Diffusion Problems (págs. 117-138). Braunsch-weight: Vieweg Verlag.
[19] Korsmeyer, R. W., Gurny, R., Doelker, E., Buri, P., & Peppas, N. A. (1983). Mechanisms of solute release from porous hydrophilic polymers. International Journal of Pharmaceutics, 15, 25-35.
[20] Lee, B. W., Peterson, J. J., Yin, K., Stockdale, G. S., Liu, Y. C., & O’Brien, A. (2020). System model development and computer experiments for continuous API manufacturing. Chemical Engineering Research and Design. doi: https://doi.org/10.1016/j.cherd.2020.02.003
[21] Markl, D., & Zeitler, J. (2017). A review of disintegration mechanisms and measurement techniques. Pharmaceutical Research, 34, 890-917.
[22] Markl, D., Warman, M., Dumarey, M., Bergman, E.-L., Folestad, S., Shi, Z., . . . Zeitler, A. J. (2020). Review of Real-Time Release Testing of Pharmaceutical Tablets: State-of-the-Art, Challenges and Future Perspective. International Journal of Pharmaceutics, 582, 119353.
[23] Nagy, B., Petra, D., Galata, D., Démuth, B., Borbás, E., Marosi, G., . . . Farkas, A. (2019). Application of artificial neural networks for Process Analytical Technology-based dissolution testing. International Journal of Pharmaceutics, 567, 118464.
[24] Nanjwade, B., Mhase, S., & Manvi, F. (2011). Formulation of extended-release metformin hydrochloride matrix tablets. Tropical Journal of Pharmaceutical Research, 10(4), 375-383.
[25] Otsuka, M., Tanabe, H., Osaki, K., Otsuka, K., & Ozaki, Y. (2007). Chemoinformetrical evaluation of dissolution property of indomethacin tablets by near-infrared spectroscopy. Journal of Pharmaceutical Sciences, 96(4), 788-801.
[26] Pawar, P., Wang, Y., Keyvan, G., Callegari, G., Cuitino, A., & Muzzio, F. (2016). Enabling real time release testing by NIR prediction of dissolution of tablets made by continuous direct compression (CDC). International Journal of Pharmaceutics, 512(1), 96-107.
[27] Quodbach, J., & Kleinebudde, P. (2015). A critical review on tablet disintegration. Pharmaceutical Development and Technology, 1-12.
[28] Rogers, L., Briggs, N., Achermann, R., Adamo, A., Azad, M., Brancazio, D., . . . Jensen, K. F. (2020). Continuous production of five active pharmaceutical ingredients in flexible plug-and-play modules: A demonstration campaign. Organic Processes Research & Development, 24(10), 2183-2196.
[29] Sacher, S., Celikovic, S., Rehrl, J., Poms, J., Kirchengast, M., Kruisz, J., . . . Khinast, J. G. (2020). Towards a novel continuous HME-Tableting line: Process development and control concept. European Journal of Pharmaceutical Sciences, 142, 105097.
[30] Shrivas, M., Khunt, D., Shrivas, M., Choudhari, M., Rathod, R., & Misra, M. (2020). Advances in In Vivo predictive dissolution testing of solid oral formulations: How closer to in vivo performance? Journal of Pharmaceutical Innovation, 15, 296-317.
[31] Singh, R., Sahay, A., Muzzio, F., Ierapetritou, M., & Ramachandran, R. (2014). A systematic framework for onsite design and implementation of a control system in a continuous tablet manufacturing process. Computer & Chemical Engineering, 66, 186-200.
[32] Stevens, R. E., Gray, V., Dorantes, A., Gold, L., & Pham, L. (2015). Scientific and regulatory standards for assessing product performance using the similarity factor, f2. The AAPS Journal, 17(2), 301-306.
[33] Su, Q., Bommireddy, Y., Shah, Y., Ganesh, S., Moreno, M., Liu, J., . . . Nagy, Z. K. (2019b). Data reconciliation in the Quality-by-Design (QbD) implementation of pharmaceutical continuous tablet manufacturing. International Journal of Pharmaceutics, 563, 259-272.
[34] Su, Q., Chiu, M., & Braatz, R. (2014). Modeling and Bayesian parameter estimation for semi-batch pH-shift reactive crystallization of L-glutamic acid. AIChE Journal, 60, 2828-2838.
[35] Su, Q., Ganesh, S., Moreno, M., Bommireddy, Y., Gonzalez, M., Reklaitis, G. V., & Nagy, Z. K. (2019a). A perspective on Quality-by-Control (QbC) in pharmaceutical Continuous Manufacturing. Comptuer & Chemical Engineering, 125, 216-231.
[36] Testa, C. J., Hu, C., Shvedova, K., Wu, W., Sayin, R., Casati, F., . . . Mascia, S. (2020). Design and Commercialization of an end-to-end continuous pharmaceutical production process: A pilot plant case study. Organic Process Research & Development, 24(12), 2874-2889.
[37] Wilms, A., Meier, R., & Kleinebudde, P. (2021). Development and evaluation of an in-line and on-line monitoring system for granule size distributions in continuous roll compaction/dry granulation based on laser diffraction. Journal of Pharmaceutical Innovation, 16, 247-257. doi: https://doi.org/10.1007/s12247-020-09443-3
[38] Wilson, D., Wren, S., & Reynolds, G. (2012). Linking dissolution to disintegration in immediate release tablets using image analysis and a population balance modelling approach. Pharmaceutical Research, 29, 198-208.
[39] Zaborenko, N., Shi, Z., Corredor, C., ith-Goettler, B., Zhang, L., Hermans, A., . . . Zacour, B. (2019). First-principles and Empirical Approaches to Predicting In Vitro Dissolution for Pharmaceutical Formulation and Process Development and for Product Release Testing. AAPS Journal, 21, 32.
13 min
Brands: IMA Active, IMA S.p.A. – Active Division
5 min
Brands: IMA Active, IMA S.p.A. – Active Division, IMA S.p.A. – Automation Division Bologna
White paper
Effervescent tablet processing and packaging: why integrated lines are shaping the future.
6 min
Brands: IMA S.p.A. – Active Division, IMA Active

6 min
Brands: IMA Active, IMA S.p.A. – Active Division
11 min
Brands: IMA Active, IMA S.p.A. – Active Division
White paper
ARCA: AI Root Cause Analysis.

8 min
Brands: IMA Active, IMA S.p.A. – Active Division
5 min
Brands: IMA Active, IMA S.p.A. – Active Division
Case study
AMIX Nutrition and IMA Active: technological evolution supporting next generation sports nutrition.
5 min
Brands: IMA Active, IMA S.p.A. – Active Division

6 min
Brands: IMA Active, IMA S.p.A. – Active Division

9 min
Brands: IMA Active, IMA S.p.A. – Active Division