Case study
Development of an automated multi-stage continuous reactive crystallisation system with inline PATs for high viscosity process.
-
Reading time 29 min
-
A study by

-
In collaboration with

-
Exclusively for
Reaction Chemistry & Engineering
An automated multi-stage continuous reaction system with in-line PATs for a high viscosity reactive crystallisation process was developed in the present study. Data acquisition (DAQ) hardware and Labview software were used as the local control system.
A “forward-backward” burst pumping strategy was developed to smoothly transfer the highly viscous hot slurry from one vessel to the next. In addition, a comparative analysis between a plug flow reactor (PFR) and continuous stirred-tank reactors (CSTRs) in series revealed that to achieve the same conversion, the latter would require more volume than the former, but less than a single CSTR. For a second-order reaction, the value of the Damköhler number necessary to achieve conversion of 90.0% in a single CSTR is 90. Thus, it is reasonable to approximate a PFR using CSTRs in series to obtain a high yield with a smaller reaction volume (compared with a single CSTR). As the probes could not be positioned in the hot slurry due to fouling issues, in-line focused beam reflectance measurement (FBRM) and React IR were used to monitor the crystal size and reactant concentration in the vessel containing the cold slurry. E-factors of batch and continuous processes were also compared and the continuous reaction could obtain a lower E-factor because less waste was generated.
Introduction
Pharmaceutical synthesis remains one of the last industrial processes to use “batch” or non-continuous approaches. [1] Conversely, other industries, such as petrochemicals, automobiles, electronics, and food, have moved forward with automated and continuous operations. Pharmaceutical companies generally manufacture the active pharmaceutical ingredient (API) at one company plant, and formulate the API with excipients into the final drug product at a separate plant. It is a fragmented process with a long lead-time and a large plant footprint.
This time-space inefficiency has led to an increased interest in Integrated Continuous Manufacturing (ICM) of APIs and drug products as a seamless end-to-end process. [2-6] Advantages of Continuous Manufacturing include:
• Flexibility,
• Speeding up the supply chain,
• Agility and reduced scale-up efforts,
• Real-time quality assurance and better engineered systems,
• Decentralized and individualized manufacturing,
• Reduced footprint and investment costs,
• Societal benefits. [7, 8]
Continuous Manufacturing processes of pharmaceuticals can include the following steps: reaction, [9-15] crystallisation, [16-27] filtration, [28-30] drying,[31-36] and hot melt extrusion (HME). [37-40] Reaction and crystallisation are two early stages that occur in the upstream process development in the pharmaceutical industry. Sometimes, reaction and crystallisation processes occur simultaneously – this is known as reactive crystallisation, or precipitation. [41]
The crystallisation involves the reaction between reactants to form an intermediate product or end product, which immediately crystallises out of solution. Reactive crystallisation consists of primary processes that occur simultaneously, such as reaction, mass transfer, and rapid nucleation and growth, as well as secondary processes, such as aging, ripening, agglomeration, and breakage. [41] The driving force responsible for crystallisation is the generation of supersaturation conditions by the reaction. Therefore, low solubility of the product in the solvent is necessary. Crystallisation can affect several quality attributes of drug substances, including size distribution, shape, polymorphic form, and purity. Variations in these attributes may have a significant impact on drug dissolution, bioavailability, efficacy, and, in some cases, safety of the drug product. [42] To produce small mean size particles, high supersaturation with high rates of nucleation is necessary. Reactive crystallisation is widely known to produce such levels of supersaturation.
Understanding Continuous Manufacturing processes is necessary to precisely control them. Scientists and engineers working in process development and Continuous Manufacturing of pharmaceuticals aim to minimise variability in product quality.[43] Process analytical technology (PAT), which is defined by the U.S. Food and Drug Administration (FDA) as “a system for designing, analysing, and controlling manufacturing through timely measurements (i.e., during processing) of critical quality and performance attributes of raw and in-process materials and processes, with the goal of ensuring final product quality”, is key to understanding Continuous Manufacturing processes. Focused beam reflectance measurement (FBRM), React IR, Ra-man spectroscopy, and near-infrared spectroscopy (NIR) are common PATs used in the API manufacturing process. FBRM is a probe-based instrument that is inserted directly into offline samples or in-line continuous processes to track changing particle size and count in real time at full process concentrations. FBRM has been widely used for the characterisation of crystallisation systems, including developing and optimising crystallisation processes,[44-48] tracking and troubleshooting crystalliser systems, [49-55] and monitoring polymorphic forms. [52-56] React IR is a real-time, in situ mid-infrared based system, and is designed to study reaction progress and provide specific information about the initiation, conversion, intermediates, and endpoints of a reaction. [57-59] Raman spectroscopy is a spectroscopic technique used to monitor rotational, vibrational and other low frequency modes, and is commonly used to determine the polymorphic form during a crystallisation process.[60-62] NIR is a spectroscopic method that uses the near-infrared region of the electromagnetic spectrum, and has been employed both with attenuated total reflection (ATR) probes for solute concentration measurement and without ATR for analysing API powders and tablets.[61-62].
Green chemistry has become the focus in both academia and industry during the past decade. It is a means to achieve the ultimate common goal: sustainability. [63] Amnemonic, Productively (prevent waste; renewable materials; omit derivatization steps; degradable chemical products; use safe synthetic methods; catalytic reagents; temperature, pressure ambient; inprocess monitoring; very few auxiliary substances; E-factor, maximise feed in product; low toxicity of chemical products; yes, it is safe) was proposed by Poliakoff and co-works [64] to capture the spirit of the twelve principles of green chemistry. [65]
The E-factor, defined as the mass of the wastes generated relative to the mass of the desired products formed, helps to estimate how “green” a process is.
The E-factors for bulk, and fine chemicals industry are <1–5, and 5–>50, respectively. However, for the pharmaceutical industry, the E-factor is usually between 25 and >100. [63-66] The Continuous Manufacturing of pharmaceuticals helps to reduce this high E-factor value.
In the present work, an automated multi-stage continuous reaction system with in-line PATs was developed. This is particularly relevant for high viscosity reactive crystallisation processes, where high solid concentration can lead to transfer line clogging. Therefore, a “forward-backward” pumping strategy was developed to smoothly pump the highly viscous hot slurry from one vessel to the next. The volumes of a PFR and CSTRs in series to obtain a specified conversion were compared. In-line FBRM and React IR were used to monitor the crystal size and reactant concentration during the reactive crystallisation process.
Experimental
Instruments
Digital overhead stirrers (CG-2024), 500 mL reactors, and reactor support frame were purchased from Chemglass Life Sciences (Vineland, NJ). Masterflex pumps (WU-77921-75) and temperature controllers (Model 210) were obtained from Cole-Parmer (Vernon Hills, IL) and J-Kem Scientific (University City, MO), respectively. Heat Exchangers (Unistat 405) and Gore PFL tubing (#36) were manufactured by Huber Technology (Offenburg, Germany) and W. L. Gore & Associates Inc. (New-ark, DE). Microscope (Nikon Eclipse ME600), FBRM (D600L) and React IR (ReactIR 15) were obtained from Nikon (Melville, NY), and Mettler Toledo (Columbus, OH), separately.
Experimental setup for batch reaction
The set-up used to study the reaction’s kinetics consisted of 20 mL scintillation vials outfitted with stir bars and heat blocks, as seen in Figure 1 (see ESI). Stirring was accomplished with a heating stir plate. Two heated stir plates with heat blocks were used, one was set to a temperature that would ensure dissolution of the pre-reaction materials, while the other was set to the desired reaction temperature. React IR was used to monitor the progress of the reaction. High performance liquid chromatography (HPLC) was used to measure the reaction yield and impurity profiles. Determining the total reaction time is very important, as it has implications for the reaction yield, purity, and overall process quality.
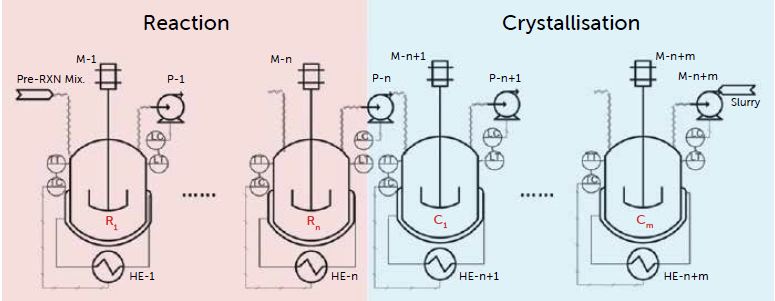
Figure 1: Figure 1: process flow diagram of the reactive crystallisation experimental apparatus (R: reactor; C: crystalliser; HE: heat exchanger; M: motor; P: pump; TC: temperature controller; TT: temperature transmitter; LC: level controller; LT: level transmitter).
Experimental set-up for continuous reaction
The process flow diagram of the continuous reactive crystallisation system is shown in Figure 1.
The set-up consists of n reactors and m crystallisers, which are temperature-controlled vessels equipped with overhead mixers. In the n reactors (R1 to Rn), the reaction goes to completion and crystallisation starts to occur. In the m crystallisers (C1 to Cm), the overall crystallisation is increased by lowering the temperature. The pre-reaction material is continuously pumped into the first reaction vessel at a low flowrate, while the mixture is subsequently pumped into the following vessels in a burst-mode. All the transfer lines are insulated. An advanced automation system was developed using DAQ hardware and Labview software (National Instruments). The graphic user interface (GUI) monitors and controls the internal and external temperatures of the heat exchangers, as well as the flowrate and direction of the pumps.
Theoretical derivation
The continuous stirred tank reactor (CSTR) and the plug flow reactor (PFR) are two types
of continuous flow reactors that are almost always operated at steady state. In a CSTR, the volume (V) necessary to achieve a specified conversion X is: [67]

Here, FA0 is the molar flowrate of A, and −rA is the reaction rate at the exit of the CSTR. In a PFR, the volume necessary to achieve X is given in an integration form: [67]

The Damköhler number, Da, is the ratio of the rate of re-action of A to the rate of convective transport of A at the entrance to the reactor, as shown in Equation 3: [67]

For a first-order reaction, [67]

where k is the reaction rate constant, and t is the space time, which is obtained by dividing reactor volume by the volumetric flow rate (υ0) entering the reactor: [67]

Conversion X of a first-order liquid-phase reaction can be expressed in terms of the Damköhler number: [67]

As a rule of thumb, when Da is less than 0.1, a conversion of less than 10% is expected; when Da is greater than 10, a conversion of greater than 90% is achieved. The conversion for n CSTRs in series will be: [67]

For a second order reaction, [67]

where CA0is the original concentration of reactant A. Accordingly, conversion X of a second order reaction is: [67]

Results and discussion
Batch reactive crystallisation
Determining the reaction temperature and time is critical, as these values strongly affect the reaction yield, purity, and overall process quality.
According to the data obtained from the batch reaction experiments (Graph 1), the yields could reach 95.4% at reaction time of 10–11 h and temperature of T and T +5 °C.
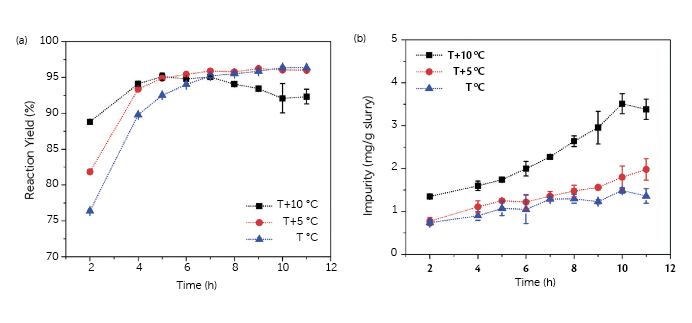
Graph 1: (a)yield and (b) impurity profiles obtained from batch reactions.
It is important to note that at T +10 °C, the yield starts to decrease after 5.0 h (see black squares in Graph 1a), and the total amount of impurities is much higher than that generated at T and T +5°C (Graph 1b). The continuous reactive crystallisation setup was developed based on these results and to obtain the highest yield and lowest amount of total impurities. The temperature in the 1st and 2nd reaction stages was T +5°C with a total reaction time of 5.0 h, and the temperature in the 3rd and 4th reaction stages was T °C with a total reaction time of 5.0 h.
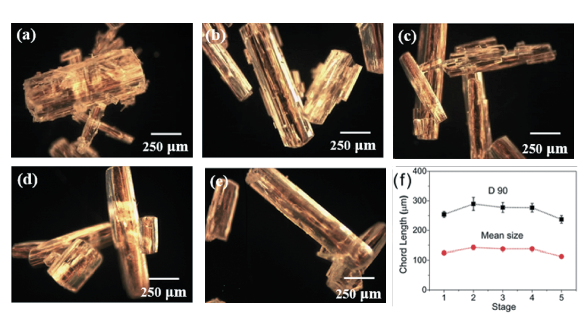
Figure 2: microscope es from in-line FBRM (D90 is the value of the particle chord lengths at 90% of its cumulative distribution).
Continuous reactive crystallisation
Several extended continuous experiments were performed to investigate the morphology and crystal size distributions (Figure 2), reaction and crystallisation yields and impurity profiles (Figure 3) for the present reactive crystallisation system. Figure 2a-e provide microscope images of product P crystals for each stage, which demonstrates that solid columns have been obtained. Figure 2f shows the trend of crystal size in the different stages obtained from in-line FBRM (see in-line PATs section for more details).
Graph 2a shows the reaction yield profile of the continuous reaction. Samples for reach stage were taken every hour to study the stability of the process. At the beginning of the experiment, each vessel is empty (reaction starts with ‘empty mode’). After -10.0 h, stable yields are obtained, which are approximately 71.6 ± 1.6, 87.5 ± 1.3, 93.0 ± 1.1, and 97.0 ± 0.3% for R1, R2, R3 and R4, respectively.
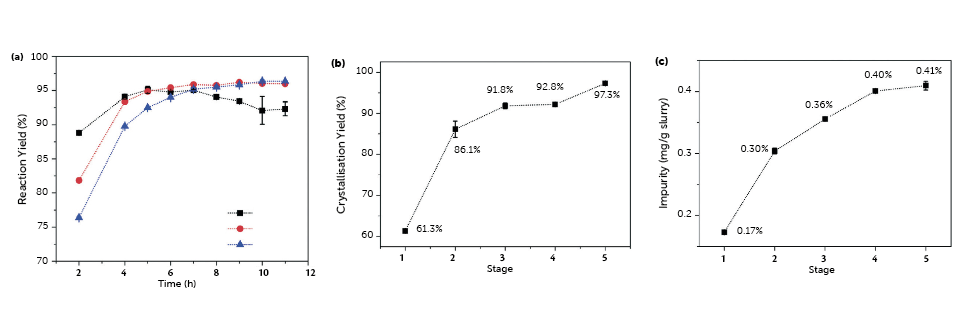
Graph 2: (a) reaction yield, (b) crystallization yield, and (c) impurity profiles obtained from continuous reaction.
The crystallisation yields (Graph 2b) for R1-R4 are 61.3 ± 0.49, 86.1 ± 1.99, 91.8 ± 0.72, and 92.8 ± 0.47%, respectively. In the last stage, the crystallisation yield increased to 97.3 ± 0.11% due to the temperature.
Graph 2c shows the impurity concentrations for each stage, which are lower than that obtained from batch reaction (Graph 1b).
For the highly viscous reactive crystallisation system detailed in this study, the slurry could not be pumped continuously because of clogging issues. A “forward-backward” burst pumping strategy was developed to transfer this high viscosity slurry from one vessel to the next. Graph 3 shows the pumping flowrates and directions for the feed pump and the transfer pumps. The feed pump has a low constant forward pumping rate (e.g., 3.3 mL min-1). The transfer pumps have a high backward pumping rate (e.g., 150 mL min-1), during which the transfer tubing is emptied. Notably, each transfer tube inserts into the bottom of the previous vessel (e.g., R1), and on the top of the next vessel (e.g., R2). In this way, the slurry can only be pumped in the forward direction of R1 to Rn, and finally to Cm. At a pre-determined frequency (e.g., every 15 min), the transfer pumps change direction, pumping slurry in the forward direction at 150 mL min-1 for 25 s (5 s accounts for the dead volume of the transfer tubing). Graph 3, shows that the pumping sequence proceeds from transfer pump 5 to 1, which prevents low yield slurry from transferring into the next stage too early.
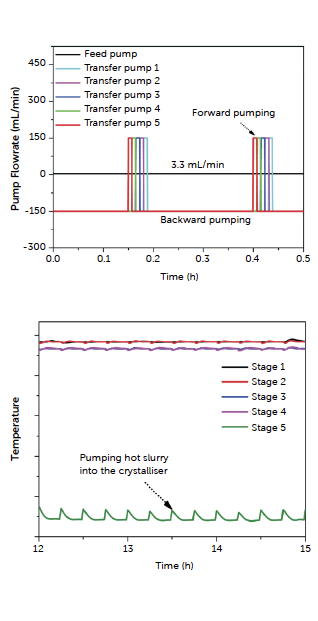
Graph 3: pumping directions for feed pump and transfer pumps.
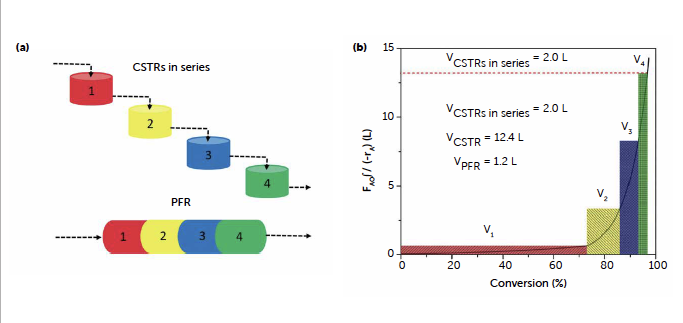
Figure 7: (a) modeling a PFR with CSTRs in series, and (b) Levenspiel plot showing comparison of a PFR with CSRTs in series.

Table 1: the value of FA0/(−rA) at different conversions.
The temperature profiles obtained from this continuous reactive crystallisation are shown in Graph 3.
The first two stages are maintained at a high temperature, while the next two stages are 5 °C lower. This strategy was implemented to achieve high reaction yields with low impurity levels. For stage 5, the temperature is set below room temperature to achieve a high crystallisation yield (per the solubility curve). However, every 15 min, approximately 50 mL of hot slurry is pumped into this stage, resulting in the observed periodic temperature fluctuations.
Approximating a PFR by CSTRs in series
In this section, the yield (before the point at which it decreases in Graph 1a) and conversion will be used interchangeably. To better understand the performance of the multi-stage continuous reaction system developed in the present study, a comparison between a PFR and CSTRs in series was performed, and is shown in Graph 4 (four stages as an example).
The total volume of the four equal-volume vessels is 2 L, and a conversion of 97.0% is obtained in the 4th stage. From Equation 1 and 2, and Table 1, the volume of one PFR (area under the solid curve in Graph 4b) for the same conversion of 97.0% is 1.2 L, which is 40% less than the volume of CSTRs in series. The volume of each CSTR was smaller than that of the PFR, and as the number of CSTRs increases to the infinity, the total volume of the CSTRs in series approaches the volume of the PFR. [67] Therefore, it makes sense to model a PFR with CSTRs in series to achieve a higher conversion with a smaller total reactor volume, compared to a single CSTR. This is especially appropriate for a high viscosity reactive crystallisation process, which would likely clog a PFR. The volume of a single CSTR (area under the red dash line in Graph 4b) that was required to obtain a conversion of 97.0 % (same throughput) was 12.4 L, which was >10 times the volume of the PFR, and >6 times the total volume of the CSTRs in series. This was because the single CSTR was always oper-ating at the lowest reaction rate, while the PFR started at a high reaction rate at the entrance and gradually decreased to a lower rate at the exit. [67]
For a first-order reaction, the number of CSTRs required for a specified conversion can be determined according to Graph 5a, which was created based on Equation 7. Based on Graph 5a and b, the numbers of CSTRs necessary to achieve a conversion of 90.0% were 1, 4, and 25 for Da of 10, 1, and 0.1, respectively.
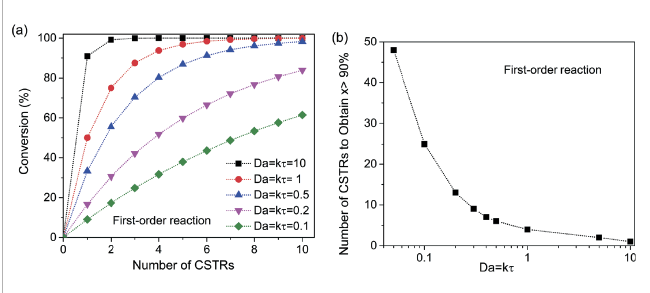
Graph 5: (a) conversion as a function of the number of CSTRs in series for different Damköhler numbers for a
first-order reaction, (b) number of CSTRs in series to obtain conversion greater than 90% as a function of Damköhler number.
For second-order reactions (which was the case in the present study, A + B > P), Da decreased as the reactant concentrations decreased. From Graph 6a, the value of Da necessary to achieve conversion of 90.0% was 90 for a second order reaction, while the value was 10 for a first-order reaction (Graph 5a). At a relatively high conversion of
71.6 ± 1.6%, a 10-fold increase in Da (this can be achieved by either increas-ing the reactor volume or raising the temperature) will increase the conversion to only 90%. Thus, to obtain a high conversion with a small reactor volume and low reaction temperatures, it was necessary to approximate a PFR using CSTRs in series. From Graph 4b, the total volume of the CSTRs in series was less than one sixth of a single CSTR for the same conversion.
Graph 6b shows the Da in each stage for a typical reactive crystallisation system. The Da drops down from 8.88 in the 1st reactor to 0.41 in the 4th reactor. These data suggest that it is more appropriate to operate a second-order reaction in a PFR or CSTRs in series, rather than in a single CSTR.
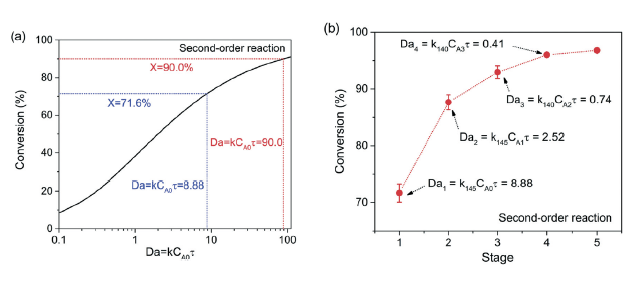
Graph 6: (a) conversion as a function of the Damköhler number for a second-order reaction, and (b) Damköhler numbers in each stage of the present reactive crystallisation system.
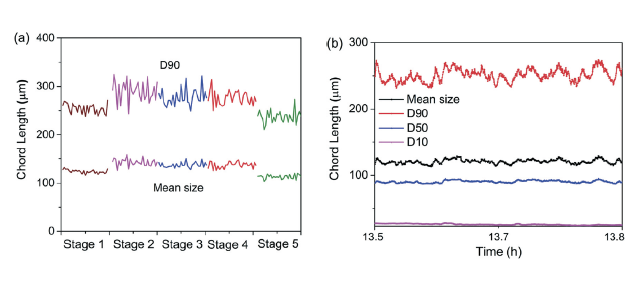
Graph 7: (a) In-line FBRM profile in each stage, and (b) inline FBRM profile in last stage.
In-line PAT measurements
FBRM and React IR were used to monitor the crystal size and reactant concentration, respectively.
Graph 7a shows the in-line FBRM profile at each stage. In the 1st stage, the reaction yield was 71.6 ± 1.6% and the product started to crystalize out with a crystallisation yield of 61.3 ± 0.5%. The crystallisation process starts with nucleation of the product, which plays a central role in determining the structure and crystal size distribution.6 [68] In the 2nd stage, the reaction yield continuously increased, as does the crystallisation yield. During this time, the crystals grew larger (from 254 to 289 μm). In the 3rd and 4th stage, the crystal size was comparable to that of 2nd stage. The changes in crystal size were affected by the crystallisation yield and Ostwald ripening. In a saturated solution, the crystal size distribution changed with time as the system tries to minimise Gibbs free energy. This led to different solubilities for small crystals and larger crystals, resulting in the former dissolving and growing on the larger particles. [69] In the last stage, the temperature dropped to a significantly lower temperature, causing more product to quickly crystallise out of solution and form smaller crystals.
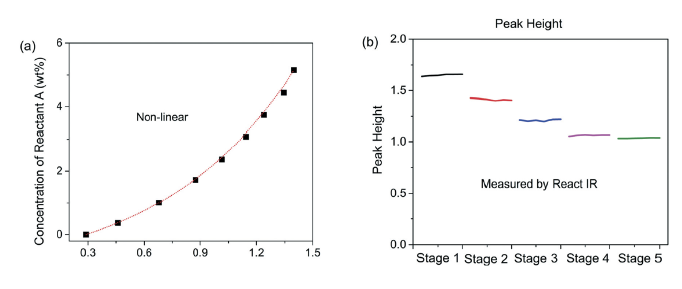
Graph 8: (a) correlation of concentration of reactant A as a function of peak height, and (b) in-line react IR measurements of concentration of reactant A in each stage.
Initially, the FBRM probe was positioned in each stage; however, fouling by product (P) crystals on the probe occurred after 5-10 minutes. Thus, the probe was placed in the last vessel, which was held at a much lower temperature
(Graph 7b). Consequently, fouling was eliminated.
For the React IR, studies were also performed: Graph 8a correlates the concentration of reactant A as a function of peak height obtained from React IR measurements. The concentration of reactant A had a non-linear relationship with peak height. Using this correlation curve, the concentration of reactant A can be predicted by measuring peak height.
Usually, for very low concentrations (e.g., <0.01 wt% in the current system), the reactant molecules were well dispersed and the correlation was nearly linear. However, there exists a critical nano-aggregation concentration (CNAC) above which the molecules started to aggregate that resulted in divergence from linear correlation. Graph 8b shows the in-line React IR measurements of reactant A in each stage. Importantly, the peak heights in the 4th and 5th stage are slightly different, although the concentration of reactant A is similar. This difference was attributed to the different temperatures at these stages (high temperature in 4th stage and low in 5th stage). Similar to the FBRM probe, the React IR probe was initially positioned in each stage. Fouling by product crystals on the probe occurred after several minutes in each of the first four stages. Thus, the probe was placed in the last vessel, which was held at a much lower temperature. Consequently, fouling was eliminated.
Advantages of continuous reaction processes
For a batch process, the reaction heat is quickly released during a short time interval, making temperature difficult to control. A wide range of temperature changes is usually observed in a batch process, while the temperature is quite stable in a continuous process (Graph 3). Controllable and stable temperatures within a narrow range facilitate obtaining higher yields (97.0% in continuous vs. 95.4% in batch) and lower impurity levels (see Graph 1b and 2c).
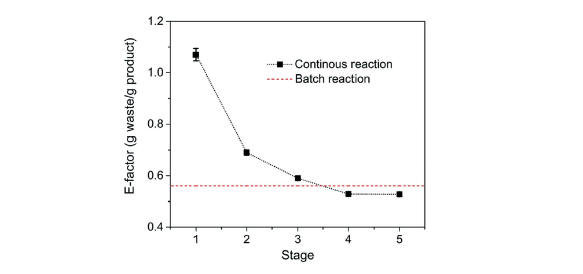
Graph 9: a comparison of E-factor value between continuous reaction and batch reaction (calculated based on the highest batch reaction yield).
Although the ideal E-factor (i.e., E-factor = 0) is impossible to achieve, progress towards lower E-factors helps to create an overall greener manufacturing process. For the production of fine chemicals and pharmaceuticals, the E-factor typically ranges from 5 to >100. [63] For example, Livingston et al. calculated the E-factor of a continuous purification of roxithromycin in a two-stage membrane cascade process with a solvent recovery stage to be ~20; [70] Gerogiorgis et al. obtained E-factors of 3-7 and~10 for continuous crystallisation of paracetamol and diphenhydramine, respectively. [71] For the present reactive crystallisation process, the E-factor was much lower due to the high concentration of reactants in the reaction mixture, and the high yield of product.
Graph 9 provides a comparison of E-factor values between a continuous and a batch reaction. The continuous reaction is able to obtain a lower E-factor than batch reaction, signifying that less waste is generated with the former.
Conclusions
An automated multi-stage continuous reaction system with in-line PATs for a high viscosity reactive crystallisation process was developed in the present study. DAQ hardware and Labview software were used as the local control system. Initially, the reaction kinetics were determined from batch reaction experiments. Based on these initial studies, the multi-stage continuous system was designed (i.e., CSTRs in series). In addition, because the highly viscous hot slurry could not be pumped continuously at the required flowrate (due to clogging), an innovative “forward-backward” burst pumping strategy was developed to smoothly transfer the slurry from vessel to vessel. The transfer pumps followed a reverse pumping sequence from 5 to 1, which prevented under-reacted slurry from pumping prematurely into the next stage. An analysis demonstrated that the volume of a PFR that could achieve a conversion of 97.0% (at the given throughput rate) was only 1.2 L, which was 40% less than the total volume of a corresponding system of CSTRs in series (i.e., 2.0 L). For a single CSTR, the volume required to obtain the same conversion (at the same throughput rate) was 12.4 L. Thus, because the current study’s highly viscous slurry could not be processed by a PFR (due to clogging), a system comprised of CSTRs in series was implemented.
This system was necessary to approximate a PFR for a second-order reaction (as the case in the present study), as the Damköhler number decreased with each successive reaction vessel.
In-line FBRM and React IR were applied to monitor the crystal size and reactant concentration, respectively. The probes were initially positioned at each stage; however, fouling occurred on the probes’ surfaces after several minutes because of the hot reactive crystallisation process. The probes were eventually located only in the lower temperature crystalliser.
For highly exothermic batch reactions, heat is quickly released during a short time interval. Conversely, heat is released more gradually with continuous processes, allowing for higher product yields and lower impurity levels to be achieved (temperature of the system is better controlled).
This improved temperature control is the case with current study’s continuous multi-CSTR system. E-factors of batch and continuous process were also compared, with the latter able to obtain lower levels, as less waste was generated.
Disclaimer
This publication only reflects the views of the authors (b) and should not be construed to represent FDA’s views or policies.
Conflicts of interest
There are no conflicts to declare.
Acknowledgements
This work has been supported by the US Food and Drug Administration (FDA) under Board Agency Announcement Contract HHSF223201610104C.
The authors also gratefully acknowledge Maria H. A. Lurantos and Husnain S. Sheikh for their help by preparing and analysing the HPLC samples
References
[1] A. Adamo, R. L. Beingessner, M. Behnam, J. Chen, T. F. Jamison, K. F. Jensen, J.-C. M. Monbaliu, A. S. Myerson, E. M. Revalor and D. R. Snead, Science, 2016, 352,61-67.
[2] S. Mascia, P. L. Heider, H. Zhang, R. Lakerveld, B. Benyahia, P. I. Barton, R. D. Braatz, C. L. Cooney, J. Evans and T. F. Jamison, Angew. Chem., Int. Ed., 2013, 52, 12359-12363.
[3] R. Service, The synthesis machine, 2015.
[4] S. Byrn, M. Futran, H. Thomas, E. Jayjock, N. Maron, R. F. Meyer, A. S. Myerson, M. P. Thien and B. L. Trout, J.Pharm. Sci., 2015, 104, 792- 802.
[5] C. Badman and B. L. Trout, J. Pharm.Sci., 2015, 104, 779-780.
[6] I. R. Baxendale, R. D. Braatz, B. K. Hodnett, K. F. Jensen, M. D. Johnson, P. Sharratt, J. P. Sherlock and A. J. Florence, J. Pharm.Sci., 2015, 104, 781-791.
[7] P. Kleinebudde, J. Khinast and J. Rantanen, Continuous Manufacturing of Pharmaceuticals, 2017.
[8] S. L. Lee, T. F. O’Connor, X. Yang, C. N. Cruz, S. Chatterjee, R. D. Madurawe, C. M. Moore, X. Y. Lawrence and J. Woodcock, J. Pharm. Innov., 2015, 10, 191-199. 9 R.
[9] R. L. Hartman, J. P. McMullen and K. F. Jensen, Angew. Chem., Int. Ed., 2011, 50, 7502-7519.
[10] C. Wiles and P. Watts, Green Chem., 2012, 14,38-54.
[11] P. Pollet, E. D. Cope, M. K. Kassner, R. Charney, S. H. Terett, K. W. Richman, W. Dubay, J. Stringer, C. A. Eckert and C. L. Liotta, Ind. Eng. Chem. Res., 2009, 48, 7032-7036.
[12] K. M. Christensen, M. J. Pedersen, K. Dam-Johansen, T. L. Holm, T. Skovby and S. Kiil, Chem. Eng. Sci., 2012, 71, 111-117.
[13] R. L. Hartman, J. R. Naber, S. L. Buchwald and K. F. Jensen, Angew. Chem., Int. Ed., 2010, 49, 899-903.
[14] C. Hu, K. H. Shaughnessy and R. L. Hartman, React. Chem. Eng., 2016, 1, 65-72.
[15] R. L. Hartman and K. F. Jensen, Lab Chip, 2009, 9, 2495-2507.
[16] J. L. Quon, H. Zhang, A. Alvarez, J. Evans, A. S. Myerson and B. L. Trout, Cryst. Growth Des., 2012, 12, 3036-3044. [17] H. Zhang, J. Quon, A. J. Alvarez, J. Evans, A. S. Myerson and B. Trout, Org. Process Res. Dev., 2012, 16, 915-924. [18] J. Chen, B. Sarma, J. M. Evans and A. S. Myerson, Cryst. Growth Des., 2011, 11, 887-895.
[19] D. W. Griffin, D. A. Mellichamp and M. F. Doherty, Chem. Eng. Sci., 2010, 65, 5770-5780.
[20] S. Y. Wong, A. P. Tatusko, B. L. Trout and A. S. Myerson, Cryst. Growth Des., 2012 12, 5701-5707.
[21] A. J. Alvarez and A. S. Myerson, Cryst. Growth Des., 2010, 10, 2219-2228.
[22] A. J. Alvarez, A. Singh and A. S. Myerson, Cryst. Growth Des., 2011, 11, 4392-4400.
[23] S. Lawton, G. Steele, P. Shering, L. Zhao, I. Laird and X.-W. Ni, Org. Process Res. Dev., 2009, 13, 1357-1363.
[24] R. Eder, E. Schmitt, J. Grill, S. Radl, H. Gruber-Woelfler and J. Khinast, Cryst. Res. Technol., 2011, 46, 227-237.
[25] R. J. Eder, S. Schrank, M. O. Besenhard, E. Roblegg, H. Gruber-Woelfler and J. G. Khinast, Cryst. Growth Des., 2012, 12, 4733-4738.
[26] S. Ferguson, G. Morris, H. Hao, M. Barrett and B. Glennon, Chem. Eng. Sci., 2013, 104,44-54.
[27] L. Zhao, V. Raval, N. E. Briggs, R. M. Bhardwaj, T. McGlone, I. D. Oswald and A. J. Florence, CrystEngComm, 2014, 16, 5769-5780.
[28] K. Plumb, Chem. Eng. Res. Des., 2005, 83, 730-738.
[29] C. Viseras, P. Cerezo, G. Meeten and A. Lopez-Galindo, Int. J. Pharm., 2001, 217, 201-213.
[30] M. Levy, I. Collins, J. Tsai, P. A. Shamlou, J. Ward and P. Dunnill, J. Biotechnol., 2000, 76, 197-205.
[31] S. T. F. Mortier, T. De Beer, K. V. Gernaey, J. Vercruysse, M. Fonteyne, J. P. Remon, C. Vervaet and I. Nopens, Eur. J. Pharm. Biopharm., 2012, 80, 682-689.
[32] Y. Gonnissen, J. P. Remon and C. Vervaet, Eur. J. Pharm. Biopharm., 2007, 67, 220-226.
[33] Y. Gonnissen, S. Goncalves, B. De Geest, J. P. Remon and C. Vervaet, Eur. J. Pharm. Biopharm., 2008, 68, 760-770. [34] M. Wang, G. C. Rutledge, A. S. Myerson and B. L. Trout, J. Pharm. Sci., 2012, 101, 1178-1188.
[35] B. Brettmann, E. Bell, A. Myerson and B. Trout, J. Pharm. Sci., 2012, 101, 1538-1545.
[36] B. K. Brettmann, K. Cheng, A. S. Myerson and B. L. Trout, Pharm. Res., 2013, 30, 238-246.
[37] M. M. Crowley, F. Zhang, M. A. Repka, S. Thumma, S. B. Upadhye, S. Kumar Battu, J. W. McGinity and C. Martin, Drug Dev. Ind. Pharm., 2007, 33, 909-926.
[38] M. A. Repka, S. K. Battu, S. B. Upadhye, S. Thumma, M. M. Crowley, F. Zhang, C. Martin and J. W. McGinity, Drug Dev. Ind. Pharm., 2007, 33, 1043-1057.
[39] M. M. Crowley, B. Schroeder, A. Fredersdorf, S. Obara, M.Talarico, S. Kucera and J. W. McGinity, Int. J. Pharm., 2004, 269, 509- 522.
[40] R. Chokshi and H. Zia, Iran. J. Pharm. Res., 2010, 3-16.
[41] V. V. Kelkar and K. M. Ng, AIChE J., 1999, 45,69-81.
[42] H. Wu, Z. Dong, H. Li and M. Khan, Org. Process Res. Dev.,2015, 19,89-101.
[43] L. L. Simon, H. Pataki, G. r. Marosi, F. Meemken, K. Hungerbühler, A. Baiker, S. Tummala, B. Glennon, M. Kuentz and G. Steele, Org. Process Res. Dev., 2015, 19,3-62.
[44] J. Worlitschek and M. Mazzotti, Cryst. Growth Des., 2004, 4, 891-903.
[45] N. Doki, H. Seki, K. Takano, H. Asatani, M. Yokota and N. Kubota, Cryst. Growth Des., 2004, 4, 949-953.
[46] A. Saleemi, C. Rielly and Z. Nagy, Chem. Eng. Sci., 2012, 77, 122-129.
[47] A. N. Saleemi, C. D. Rielly and Z. K. Nagy, Cryst. Growth Des., 2012, 12, 1792-1807.
[48] M. Jiang, X. Zhu, M. C. Molaro, M. L. Rasche, H. Zhang, K. Chadwick, D. M. Raimondo, K.-K. K. Kim, L. Zhou and Z. Zhu, Ind. Eng. Chem. Res., 2014, 53, 5325-5336.
[49] Z. Q. Yu, P. S. Chow and R. B. Tan, Ind. Eng. Chem. Res., 2006, 45, 438-444.
[50] Z. Wang, J. Wang and L. Dang, Org. Process Res. Dev., 2006, 10, 450-456.
[51] X. J. Wang and C. B. Ching, Chem. Eng. Sci., 2006, 61, 2406-2417.
[52] B. O’Sullivan and B. Glennon, Org. Process Res. Dev., 2005, 9, 884-889.
[53] E. Deneau and G. Steele, Org. Process Res. Dev., 2005, 9, 943-950.
[54] E. Kougoulos, A. Jones and M. Wood-Kaczmar, Powder Technol., 2005, 155, 153-158.
[55] P. Barrett and B. Glennon, Chem. Eng. Res. Des., 2002, 80, 799-805.
[56] J. Schöll, D. Bonalumi, L. Vicum, M. Mazzotti and M. Müller, Cryst. Growth Des., 2006, 6, 881-891.
[57] D. Stead, G. Carbone, P. O’Brien, K. R. Campos, I. Coldham and A. Sanderson, J. Am. Chem. Soc., 2010, 132, 7260-7261.
[58] G. Barker, J. L. McGrath, A. Klapars, D. Stead, G. Zhou, K. R. Campos and P. O’Brien, J. Org. Chem., 2011, 76, 5936-5953.
[59] D. A. Foley, C. W. Doecke, J. Y. Buser, J. M. Merritt, L. Murphy, M. Kissane, S. G. Collins, A. R. Maguire and A. Kaerner J, . Org. Chem., 2011, 76, 9630-9640.
[60] D. Acevedo, X. Yang, A. Mohammad, N. Pavurala, W. – L. Wu, T. F. O’Connor, Z. K. Nagy and C. N. Cruz, Org. Process Res. Dev., 2018, 22, 156-165.
[61] E. Simone, A. Saleemi and Z. Nagy, Org. Process Res. Dev., 2014, 19, 167-177.
[62] E. Simone, A. N. Saleemi and Z. K. Nagy, Chem. Eng. Technol., 2014, 37, 1305-1313.
[63] R. A. Sheldon, Chem. Commun., 2008, 3352-3365.
[64] S. L. Tang, R. L. Smith and M. Poliakoff, Green Chem., 2005, 7, 761-762.
[65] P. T. Anastas and M. M. Kirchhoff, Acc. Chem. Res., 2002, 35, 686-694.
[66] B. H. Lipshutz, N. A. Isley, J. C. Fennewald and E. D. Slack, Angew. Chem., Int. Ed., 2013, 52, 10952-10958.
[67] H. S. Fogler, Elements of chemical reaction engineering, 1999.
[68] A. S. Myerson and B. L. Trout, Science, 2013, 341, 855-856.
[69] A. Myerson, Handbook of industrial crystallization, Butterworth-Heinemann, 2002.
[70] L. Peeva, J. da Silva Burgal, I. Valtcheva and A. G. Livingston, Chem. Eng. Sci., 2014, 116, 183-194.
[71] H. Jolliffe and D. I. Gerogiorgis, Comput. Chem. Eng., 2018, DOI: 10.1016/j.compchemeng.2018.03.020.
Chuntian Hua, Joshua E. Finkelsteina, Wei Wua, Khrystyna Shvedovaa, Christopher J. Testa,a Stephen C. Born,a Bayan Takizawaa, Thomas F. O’Connor,b Xiaochuan Yangb, Sukumar Ramanujamc and Salvatore Mascia.
a) CONTINUUS Pharmaceuticals, 25R Olympia Ave, Woburn, MA, 01801, USA. E- mail: chu@continuuspharma.com, smascia@continuruspharma.com
b) Food and Drug Administration, 10903 New Hampshire Ave, Silver Spring, MD, 20993, USA
c) USV Private Limited, Arvind Vithal Gandhi Chowk, BSD Marg, Station Road, Govandi East, Mumbai, 400080, India
13 min
Brands: IMA S.p.A. – Active Division, IMA Active
White paper
Sustainability benefits of Near-Infrared (NIR) integrated powder blending in pharmaceutical manufacturing.
7 min
Brands: IMA Active, IMA S.p.A. – Active Division
5 min
Brands: IMA S.p.A. – Active Division, IMA Active
7 min
Brands: IMA S.p.A. – Active Division, IMA Active
7 min
Brands: IMA Active, IMA S.p.A. – Active Division
6 min
Brands: IMA S.p.A. – Active Division, IMA Active
12 min
Brands: IMA S.p.A. – Active Division
11 min
Brands: IMA Active, IMA S.p.A. – Active Division
8 min
Brands: IMA Active, IMA S.p.A. – Active Division

11 min
Brands: IMA Active, IMA S.p.A. – Active Division